Bitcoin price analysis reveals a tumultuous period for the leading cryptocurrency, as its market value has experienced a sharp decline in recent days, raising concerns among investors about the sustainability of the current bull market. Despite this downturn, there remains a glimmer of hope, with critical support levels being tested that could stabilize Bitcoin’s price in the near term. Employing technical analysis Bitcoin techniques, analysts are closely monitoring the 200-day moving average, which is acting as a vital support level around the $80K mark. Factors such as bullish divergence and funding rates in the futures market are also playing significant roles in shaping market sentiment and future price movements. As we delve deeper into this analysis, it is essential to consider both the current bearish trends and the potential for recovery in the cryptocurrency market.
Analyzing Bitcoin’s price trends is crucial for understanding the broader dynamics of the digital currency landscape. Recent fluctuations have led to increased interest in alternative metrics, such as support thresholds and technical indicators, to gauge potential reversals. The current bearish sentiment, reflected in the funding rates of the futures market, suggests that traders are adjusting their positions in anticipation of market shifts. Observing the recent bullish divergence in the Relative Strength Index (RSI) provides insights into potential recovery scenarios. As we explore these elements, we aim to provide a comprehensive overview of Bitcoin’s price trajectory and its implications for future investment strategies.
Current Bitcoin Price Trends and Analysis
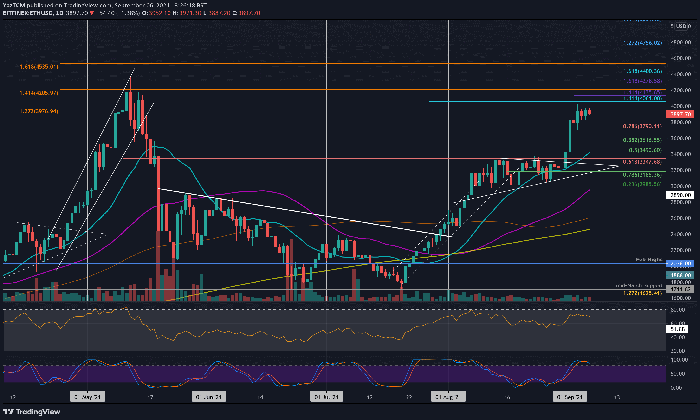
Bitcoin’s recent price movements have caught the attention of both investors and analysts alike. Over the past week, the cryptocurrency has seen a significant decline, raising concerns about the sustainability of the ongoing bull market. The price has dipped below critical levels, with the 200-day moving average acting as a support near the $80K mark. This pivotal area is crucial for Bitcoin’s price recovery, as holding above this level may provide the necessary momentum for a rebound towards the $90K resistance.
Technical analysis reveals a complex picture for Bitcoin, as the daily chart indicates a steep downward trend. However, the recent bullish divergence noted in the 4-hour chart suggests that a reversal could be on the horizon. Traders are closely monitoring key support levels, and a failure to maintain the $80K range could trigger further declines to the $74K zone. It’s essential for investors to remain vigilant and consider market sentiment when evaluating Bitcoin’s trajectory.
Understanding Bitcoin’s Technical Analysis: Support Levels and Indicators
When conducting a technical analysis of Bitcoin, identifying support levels is a critical component. The current analysis highlights the $80K support level established by the 200-day moving average. This technical indicator often serves as a reliable benchmark for traders, as it reflects the average price over an extended period. If Bitcoin can hold above this level, it may indicate resilience and potential bullish momentum. Conversely, a drop below this support could lead to increased selling pressure and a further decline in price.
Additionally, the bullish divergence observed in the RSI presents an optimistic viewpoint for the short term. This indicator suggests that despite declining prices, buying momentum is building, which could lead to a price correction. Traders should also consider other technical factors and market trends, as the cryptocurrency market is known for its volatility and rapid shifts in sentiment. Evaluating these support levels and indicators helps investors make informed decisions regarding their positions in Bitcoin.
Bitcoin Price Analysis: The Role of Funding Rates in Market Sentiment
Funding rates play a pivotal role in understanding market sentiment within the Bitcoin futures market. Recently, negative funding rates have indicated that sellers are dominating, with many traders opting for leveraged shorts. This trend raises concerns about the potential for a continued price decline; however, it may also signal an impending shift. When funding rates become excessively negative, it often leads to short liquidations, which can create rapid price rallies as sellers are forced to cover their positions.
In the context of Bitcoin’s current price action, the most recent funding rate metrics suggest a critical juncture for the market. Should a bullish pullback occur, it could trigger a cascade effect that drives prices higher, especially if the market can recapture the previously established highs. Investors should remain aware of these funding trends, as they provide insight into the overall market dynamics and potential turning points in Bitcoin’s price trajectory.
Analyzing the Daily and 4-Hour Charts for Bitcoin
The daily chart analysis reveals a concerning trend for Bitcoin, as prices have been on a steep decline. However, the presence of the 200-day moving average at the $80K support level offers a glimmer of hope for investors. Observing how Bitcoin reacts around this level will be crucial in determining its next move. A sustained bounce from this area could signal a potential recovery, but traders must remain cautious of the broader market conditions.
In contrast, the 4-hour chart provides a more optimistic outlook, as recent price movements have shown signs of recovery from the $80K support. The bullish divergence in the RSI hints at increasing buying pressure, which could lead to a positive shift in market sentiment. Nevertheless, for the trend to be deemed bullish again, Bitcoin must break above the $87K high. Establishing higher highs and lows is essential for confirming a reversal, and traders should closely monitor these key levels in their analysis.
The Impact of Market Sentiment on Bitcoin’s Future
Market sentiment is a crucial factor influencing Bitcoin’s price movements, particularly in a volatile landscape like cryptocurrency. The current negative funding rates suggest a bearish outlook among traders, which can lead to further downward pressure on prices. However, understanding the psychology behind market sentiment can also reveal opportunities for strategic positioning. If the sentiment shifts from bearish to bullish due to favorable news or technical indicators, it may prompt a significant price rally.
As Bitcoin navigates through these turbulent times, staying attuned to market sentiment and funding rate trends will be vital for investors. The potential for a rebound exists, especially if there is a shift in sentiment that triggers a short-liquidation event. Therefore, analyzing market sentiment alongside technical indicators will provide a more comprehensive view of Bitcoin’s price trajectory and help traders make informed decisions.
Exploring Bullish Divergence and Its Implications for Bitcoin
Bullish divergence is a key concept in technical analysis that signals potential reversals in market trends, particularly in the context of Bitcoin. The recent observation of bullish divergence in the RSI indicates that while Bitcoin’s price has been declining, the underlying momentum is beginning to shift towards the upside. This anomaly often precedes price corrections, making it an essential factor for traders to consider when evaluating entry and exit points.
Understanding the implications of bullish divergence can also help investors gauge the overall health of the cryptocurrency market. If Bitcoin can leverage this bullish signal effectively, it may attract fresh capital and encourage a wave of buying activity. However, traders should remain cautious, as false signals can occur in volatile markets. Keeping a close eye on price action and corresponding indicators will be essential for capitalizing on potential bullish trends.
Key Support Levels to Watch for Bitcoin’s Price Recovery
Identifying key support levels is vital for understanding Bitcoin’s potential price recovery. The $80K level, reinforced by the 200-day moving average, serves as a significant barrier against further declines. Traders often look for price reactions at these support levels to make decisions about entering or exiting positions. If Bitcoin can successfully hold above this threshold, it may pave the way for a recovery towards higher resistance levels.
In addition to the $80K support, the next crucial level to monitor is the $74K area. A breach below the $80K support could trigger a cascade of selling, pushing Bitcoin closer to this lower support zone. Therefore, traders must remain vigilant and prepared for potential price fluctuations. Analyzing these support levels in conjunction with market sentiment can provide a clearer picture of Bitcoin’s recovery prospects.
The Future of Bitcoin: Analyzing Market Dynamics and Trends
As Bitcoin continues to navigate through its price fluctuations, understanding the underlying market dynamics is essential for predicting its future trajectory. The interplay between supply and demand, market sentiment, and technical indicators will significantly influence Bitcoin’s price movements. Investors should keep an eye on funding rates and overall market sentiment, as these factors can provide insight into potential shifts in price trends.
Moreover, the ongoing developments within the cryptocurrency market, such as regulatory changes and technological advancements, can also impact Bitcoin’s future. Staying informed about these trends will help traders and investors make educated decisions. As the market evolves, the ability to adapt to changing dynamics will be crucial for successfully navigating Bitcoin’s unpredictable nature.
Leveraging Technical Analysis for Strategic Trading in Bitcoin
Technical analysis serves as a powerful tool for traders looking to navigate the complexities of Bitcoin trading. By examining price charts, support levels, and indicators like RSI, traders can formulate strategies that align with market trends. The current analysis highlights the importance of the $80K support level and the need for Bitcoin to establish higher highs for a confirmed bullish trend. Utilizing these insights can help traders make more informed decisions regarding their positions.
Additionally, integrating market sentiment analysis with technical indicators can enhance trading strategies. For instance, understanding the implications of funding rates and bullish divergence can provide traders with a more comprehensive view of market conditions. As Bitcoin continues to experience volatility, employing a robust technical analysis framework will be essential for maximizing trading opportunities and minimizing risks.
Frequently Asked Questions
What is the current state of Bitcoin price analysis amid its recent decline?
Bitcoin’s price analysis shows a steep decline over the past few days, raising concerns among investors about the potential end of the bull market. However, support is being provided at the crucial $80K level, which coincides with the 200-day moving average. This support could prevent further declines, and a bounce back to the $90K level is possible if the market stabilizes.
How do support levels in Bitcoin price analysis influence market trends?
Support levels are critical in Bitcoin price analysis as they indicate where prices may stabilize before potentially rebounding. Currently, the $80K support level has been tested, and if it holds, it could signal a potential upward movement towards $90K. Conversely, if this level is breached, it could lead to a drop towards $74K, indicating a bearish trend.
What does bullish divergence mean in the context of Bitcoin price analysis?
Bullish divergence in Bitcoin price analysis refers to a situation where the price of Bitcoin makes lower lows, but the Relative Strength Index (RSI) shows higher lows. This divergence indicates a potential reversal in trend, suggesting that despite current downward momentum, a price rebound may occur. Recent analysis on the 4-hour chart highlights such bullish divergence, which could lead to a recovery.
How do funding rates impact Bitcoin price analysis and market sentiment?
Funding rates are a vital component of Bitcoin price analysis as they reflect the balance between buyers and sellers in the futures market. Negative funding rates, like those recently observed, indicate that sellers are dominating, which can be concerning. However, this scenario may also point to an impending short squeeze, potentially leading to a bullish reversal in the Bitcoin market.
What role does technical analysis play in understanding Bitcoin price movements?
Technical analysis is essential in understanding Bitcoin price movements as it involves analyzing price charts, patterns, and indicators such as moving averages and RSI. For instance, the current technical analysis reveals that Bitcoin has been in a decline but is supported by the 200-day moving average at $80K, suggesting that careful monitoring of these indicators is crucial for predicting future price action.
What are the implications of the recent Bitcoin price analysis for investors?
The recent Bitcoin price analysis suggests caution for investors, as the market has shown volatility with a significant decline. However, the presence of critical support levels and bullish divergence indicates potential for a recovery. Investors should keep an eye on these indicators and the futures market sentiment, particularly funding rates, to make informed decisions.
| Aspect | Details |
|---|---|
| Current Price Trend | Bitcoin’s price has been declining rapidly, raising concerns about the end of the bull market. |
| Daily Chart Analysis | Support at the 200-day moving average near $80K is crucial. A bounce back to $90K is possible, but a drop to $74K could occur if support is breached. |
| 4-Hour Chart Analysis | The market shows a rebound from the $80K level, but needs to surpass the $87K mark to confirm a bullish trend. |
| Funding Rates Sentiment | Recent funding rates indicate a bearish sentiment, with sellers dominating. However, this may lead to a bullish pullback if conditions change. |
| Conclusion | The coming days are critical for Bitcoin’s price, as the market sentiment and technical indicators will determine whether it can recover or face further declines. |
Summary
Bitcoin price analysis reveals a critical juncture for the cryptocurrency as it faces significant support at the $80K level. While the recent decline has raised concerns about the bull market’s end, the potential for a bounce back remains. The analysis indicates that the next few days will be pivotal in shaping Bitcoin’s mid- to long-term outlook.
Bitcoin price analysis is crucial for investors navigating the volatile cryptocurrency market, especially amidst recent fluctuations. As Bitcoin experiences significant price drops, understanding its technical indicators and support levels becomes imperative. With the 200-day moving average hovering around the $80K support level, it offers a critical buffer against further declines. Additionally, bullish divergence signals on the charts may hint at potential recovery, despite the current bearish sentiment. By examining funding rates in the futures market, traders can better gauge market sentiment and make informed decisions regarding their positions.
Analyzing the value of Bitcoin involves a deep dive into its price trends and market behavior, offering insights that can guide investment strategies. This assessment includes evaluating the cryptocurrency’s recent performance, identifying significant support levels, and interpreting technical indicators like the RSI. Observing the market sentiment through funding rates can also provide clues about trader sentiment and potential future price movements. As we explore the intricacies of Bitcoin’s market dynamics, it’s essential to remain vigilant about the signs that could indicate a shift in the current trend. Understanding these elements will empower investors to make better-informed decisions in an ever-evolving digital asset landscape.