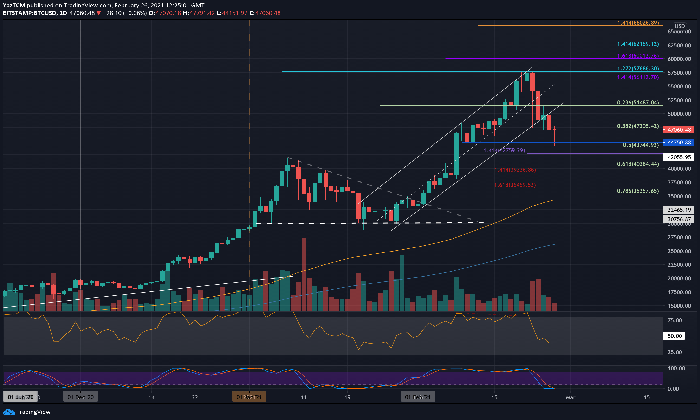
Bitcoin price discovery is reaching a critical juncture as traders anticipate a potential upward movement above $110,000 that could mark a significant shift in the market. With over $3 billion in short positions at risk if BTC bulls can push prices above $107,000, the prospect of a liquidation cascade looms large, potentially propelling Bitcoin into uncharted territory. Analysts are closely monitoring Bitcoin market trends, looking for a monthly close above $102,400 to solidify bullish sentiment and reinforce a powerful bull market. As we dive deeper into Bitcoin price prediction, we observe that the cryptocurrency has recently displayed robust patterns that suggest an upcoming rally may be on the horizon. With volatility on the rise, a comprehensive crypto price analysis indicates that Bitcoin could be primed for its most impressive monthly performance since 2019.
Delving into the dynamics of Bitcoin’s value assessment reveals the fascinating concept of market price evolution. As cryptocurrencies navigate fluctuating buyer and seller sentiment, the drawing of a clear price trend becomes evident, especially as BTC faces a critical threshold. The potential for Bitcoin to interact with existing short positions at around $107,000 necessitates careful analysis, particularly as the asset approaches its all-time high of $110,000. Observations from technical analysts speak to heightened market activity and increasing volatility, suggesting the imminent possibility of a breakout. This intricate interplay of financial forces not only underscores Bitcoin’s bullish momentum but also encapsulates the underlying mechanisms driving the crypto space.
Understanding Bitcoin Price Discovery
Bitcoin price discovery is a crucial phase in the cryptocurrency market, where the price of Bitcoin will be established based on the dynamics between buyers and sellers. This phase is particularly significant as it can indicate whether Bitcoin is ready to break free from its previous all-time high. Currently, analysts are eyeing a price level above $110,000, which would signal not just a new peak, but also trigger a wave of enthusiastic buying that can drive prices substantially higher. As traders evaluate this price point, they rely on market trends, historical price data, and projections to anticipate future movements.
At the heart of this price discovery will be the movement of investors who are currently holding short positions. With over $3 billion in short positions opening up above $107,000, the pressure could lead to a surge in Bitcoin’s price as these shorts are liquidated. Essentially, the momentum created from these liquidations can vastly enhance Bitcoin’s trajectory, potentially leading to substantial increases in market valuation as traders react to the new price levels established.
The Role of Liquidation Magnets in Bitcoin Trading
Liquidation magnets are essential concepts in trading, especially in the crypto landscape. They refer to certain price zones where the risks of forced selling can cause significant moves in the market. For Bitcoin, the critical level above $107,000 is being branded as a liquidation magnet for short sellers, indicating that if the price reaches these heights, many positions may be forcibly closed, driving the price even higher. This mechanic highlights the bullish market sentiment currently surrounding Bitcoin, where traders are expecting an upward trend that outmatches historical averages.
The pressure stemming from such liquidations creates an environment ripe for rapid price growth. Historical patterns show that when volatility accumulates in the way Bitcoin has shown recently, traders can expect major breakout events—moments when the price surges significantly, often catching off-guard those holding on to short positions. Therefore, understanding these dynamics can assist traders in making informed decisions about entering the market and predicting market trends.
Analyzing Bitcoin Market Trends
Current market trends for Bitcoin are a mix of optimism and careful analysis, as traders determine the direction of BTC in the coming weeks. The recent record weekly close of $106,407 indicates a bullish sentiment flowing through the market. In evaluating Bitcoin’s potential to reach the $110,000 mark, it’s important to consider upcoming events like the “golden cross” that historically suggests further price increases. A golden cross occurs when the short-term price averages intersect above long-term averages, signaling to traders that a sustained upward trend may begin.
Moreover, Bitcoin’s ability to close above $102,400 at the end of the month will mark one of the highest monthly closes in its history, reinforcing the notion of a burgeoning bull market. Analysts are optimistic that a sustained movement above this threshold could unleash new capital and momentum into the market, propelling Bitcoin price predictions into previously unexplored territories and solidifying its place in the growing crypto economy.
The Impact of RSI on Bitcoin’s Performance
The Relative Strength Index (RSI) serves as a vital tool for many Bitcoin traders, helping them identify potential reversals and price momentum in the market. Currently, with Bitcoin nearing record highs, traders are observing the RSI closely to gauge whether the asset is overbought or if there’s room for further gains. A high RSI could suggest that Bitcoin is gearing up for a correction; however, if the momentum remains strong, it can signify the onset of an even bullish market, emboldening investors further.
Additionally, an RSI reading that indicates consolidation can lead to opportunities for strategic entry points within the same bullish trend. Traders analyzing the combination of price trends and RSI can better position themselves, especially as liquidations loom on the horizon at the significant levels due to growing bullish pressure. Thus, understanding the interplay between RSI and market movements can be crucial for navigating the current trading landscape.
Market Sentiment and Bitcoin Price Predictions
Market sentiment greatly impacts Bitcoin, as it reflects the collective feelings and opinions of traders and investors. In times of bullish momentum, such sentiment drives trading behaviors, often causing rapid price advancements as more participants look to capitalize on gains. With Bitcoin in a phase of potential price discovery, positive sentiment suggests that many are betting on reaching new highs. This anticipation can create a self-fulfilling prophecy, where the mere expectation of rising prices invites further buying, pushing Bitcoin up.
Conversely, any hints of negative sentiment can lead to swift sell-offs, demonstrating the volatility inherent in the cryptocurrency market. Analysts and traders constantly adjust their Bitcoin price predictions based on sentiment indicators, including social media trends, market news, and trader behavior. The ability to interpret these signals effectively can be crucial in driving successful investment strategies during turbulent times.
Bollinger Bands and Bitcoin Volatility
Bollinger Bands are frequently used by traders to assess market volatility for Bitcoin. They consist of a middle band (the moving average) and two outer bands that represent price volatility. When the price comes closer to the outer bands, it may indicate a price move in the opposite direction, which can be profitable for traders if timed correctly. Currently, Bitcoin seems to be approaching these outer bands, hinting at increasing volatility in the market, which may play into the upcoming phase of price discovery.
This increase in volatility aligns with recent trends indicating that Bitcoin’s price may be preparing for a breakout. As traders monitor these bands, they can make educated decisions about their positions. Additionally, observing Bollinger Bands alongside other technical indicators may reveal whether Bitcoin is climbing towards that crucial $110,000 liquidation magnet or if corrections may be necessary ahead of any potential upward momentum.
Technical Patterns Indicating Future BTC Movement
Technical analysis in the Bitcoin landscape has recently highlighted pivotal patterns that foretell major shifts in price movement. Patterns of price compression have emerged, suggesting that Bitcoin is nearing a breakout phase. Historical analysis of Bitcoin’s pricing shows that similar compressions have led to significant rallying periods in the past, especially in notable bull markets like that of 2017. These patterns not only indicate possible future performance but also serve as a guide for investors navigating their market strategies.
Incorporating various technical indicators along with these patterns can offer additional insights into potential Bitcoin performance. By analyzing the price movements, traders can discern buy or sell signals that align with overarching market trends, particularly as Bitcoin approaches critical levels of resistance. Understanding these technical insights is essential for maximizing trading opportunities and positioning in anticipation of Bitcoin reaching its peak price targets.
Historical Context of Bitcoin Price Movement
Understanding Bitcoin’s price movement requires a look at its historical context, applying lessons learned from past market cycles. Over the years, Bitcoin has demonstrated extreme volatility, but it has also rewarded long-term holders significantly. Analyzing earlier bull runs, such as that in 2017, can give context to today’s movements, as patterns and behaviors tend to repeat in the market. For instance, the recent potential for Bitcoin to breach new highs mirrors those historical rallies, marking it as a period of keen interest for traders and investors alike.
The historical performance of Bitcoin, particularly during times of high volatility, provides essential clues to current market participants. Recognizing how the market reacted during previous price discoveries can help traders identify potential outcomes for today’s rising trends. These historical data points serve as benchmarks for traders to adjust strategies according to prevailing market conditions and prepare for the uncertain dynamics of cryptocurrency trading.
The Future Outlook for Bitcoin and Its Investors
Looking ahead, the future outlook for Bitcoin appears to be optimistic, with many indicators suggesting the potential for new all-time highs. Factors such as increasing institutional adoption, enhanced regulatory clarity, and improved technological infrastructure bolster investor confidence in Bitcoin’s sustained growth. As price discovery approaches and the market reacts to liquidations, the overall consensus remains bullish. For investors, preparing for potential volatility while remaining steadfast in their long-term belief in Bitcoin can offer lucrative opportunities.
However, the intrinsic risks associated with cryptocurrency investing still hold true. Thus, it is paramount for investors to maintain due diligence, staying informed and adaptable to changing market conditions. With Bitcoin at the center of financial conversations and technological innovations, the coming months are likely to showcase fascinating developments that could redefine the contemporary investment landscape and the role of cryptocurrencies in portfolios.
Frequently Asked Questions
What does Bitcoin price discovery mean in the current market?
Bitcoin price discovery refers to the process where buyers and sellers determine the market price of BTC in previously untraded ranges. As Bitcoin approaches its all-time high, this phase could significantly impact its price trajectory, especially if it surpasses $110,000.
How does the Bitcoin bullish market influence price predictions?
In a Bitcoin bullish market, positive sentiment can lead to aggressive buying, pushing prices higher. This influences Bitcoin price predictions, as traders often anticipate upward movements based on market trends, especially during key events like price discovery above historic levels.
What is a BTC liquidation magnet and how does it affect Bitcoin’s price?
A BTC liquidation magnet is an area where a large number of short positions risk liquidation, typically above critical price levels like $107,000. If Bitcoin breaches this level, it can lead to rapid price increases as shorts are forced to cover their positions, contributing to price discovery.
How do Bitcoin market trends affect short and long positions?
Bitcoin market trends significantly impact both short and long positions. In a bullish trend, short positions face heightened risk, especially as Bitcoin approaches key levels, creating a potential liquidation undersupply that can accelerate price discovery.
What role does crypto price analysis play in forecasting Bitcoin’s price performance?
Crypto price analysis involves evaluating past price actions, market sentiment, and technical indicators to predict future movements. In the context of Bitcoin, understanding market trends and potential price discovery phases helps traders make informed predictions about BTC’s price.
| Key Point | Details |
|---|---|
| Price Discovery | Bitcoin aims for price discovery above $110,000, potentially indicated by significant momentum in the market. |
| Current Market Status | BTC is approaching critical levels, with a risk of liquidating $3 billion in shorts if it exceeds $107,000. |
| Possible High Close | Closing above $102,400 by the end of May would mark the highest monthly close in Bitcoin’s history, reinforcing bullish sentiment. |
| Golden Cross Indicator | Bitcoin is nearing a ‘golden cross’ on daily charts, suggesting potential future rallies of 45% to 60%. |
| Compression Phenomenon | Recent compressions in Bitcoin’s price have historically preceded breakouts, reminiscent of the 2017 price surge. |
| Gert van Lagen’s Analysis | A liquidation magnet above $107,000 highlights the opportunity for significant price increases. |
Summary
Bitcoin price discovery is on the horizon as BTC approaches critical resistance levels above $110,000. Recent market trends indicate that the cryptocurrency is inches away from a significant upward movement, particularly if $3 billion in short positions get liquidated. As Bitcoin gears towards setting its highest monthly close in history while facing an imminent ‘golden cross’ on charts, informed traders and investors should watch for any breakout signals that could lead to increased volatility and potential new highs. Engaging with these market movements requires careful consideration, as the ongoing price action near these pivotal levels indicates that Bitcoin is ready for discovery and exploration in uncharted territory.
Bitcoin price discovery is fast approaching, igniting excitement among traders and investors alike. With BTC’s current momentum suggesting a bullish market, the stage is set for unprecedented price movements as potential liquidation of over $3 billion in short positions looms. If Bitcoin manages to close above $102,400 by the end of the month, it would signal the highest monthly close ever, enhancing overall market trends in a significant way. This developing scenario indicates that Bitcoin is inching closer to a price point that could unleash a wave of higher valuations, driven by robust crypto price analysis and market dynamics. As BTC flirts with its all-time high of $110,000, the eyes of the crypto community are fixated on the anticipated reactions that could redefine Bitcoin’s price landscape.
As Bitcoin edges closer to a pivotal price point, the quest for optimal valuation—often referred to as price discovery in cryptocurrency circles—becomes increasingly vital. This stage is characterized by the interplay of supply and demand, with a focus on recent market patterns revealing bullish sentiments. Traders are particularly keen on current Bitcoin price forecasting, noting critical thresholds that could activate substantial bullish momentum. The potential for a major bullish trend is heightened by the presence of a liquidation magnet at $107,000, which could draw significant market activity. By evaluating market trends and Bitcoin’s trajectory, analysts are poised to interpret emerging signals that may dictate the future of this leading cryptocurrency.