The recent discussions surrounding the Ethereum price bottom are gaining momentum, especially as the cryptocurrency’s market dynamics shift. With an astonishing $1.8 billion in ETH leaving exchanges, the crypto community is buzzing with speculation on whether this could signify a turning point for Ether. Currently priced at $2,070, Ethereum has faced significant challenges, experiencing a staggering 51% decline over the past 83 days. Amid these movements, analysts are observing a potential buying opportunity, particularly as a historically significant MVRV ratio suggests Ethereum might be undervalued. As crypto news unfolds, the Ethereum analysis indicates that reclaiming key resistance levels is critical for confirming a price bottom and initiating a recovery phase.
Amidst the current volatility in the cryptocurrency landscape, many investors are turning their eyes to Ethereum’s pricing trends, pondering if the lowest levels have been reached. Recent developments indicate that a record outflow of Ether from exchanges could suggest shifting sentiments, with traders perceiving this as a rare chance to buy into the market. At this juncture, ETH’s performance can be assessed through various lenses, highlighting the urgent need for Ethereum to reclaim crucial markers to establish a firm support base. With ongoing market fluctuations, understanding the broader implications of these shifts is essential for potential investors. This analysis aims to dissect the critical indicators, exploring whether we truly stand at the forefront of an Ethereum revival.
Understanding Ethereum Price Trends
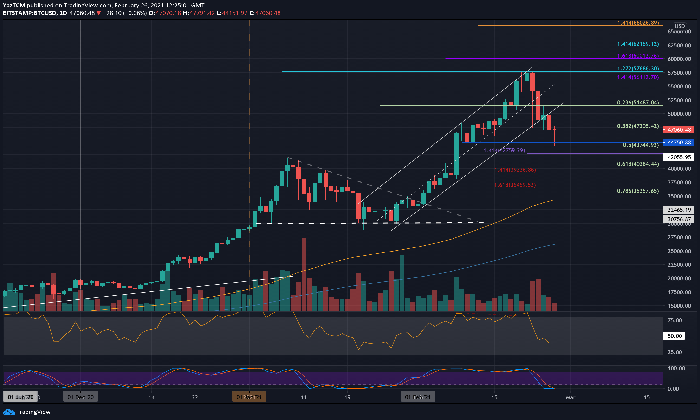
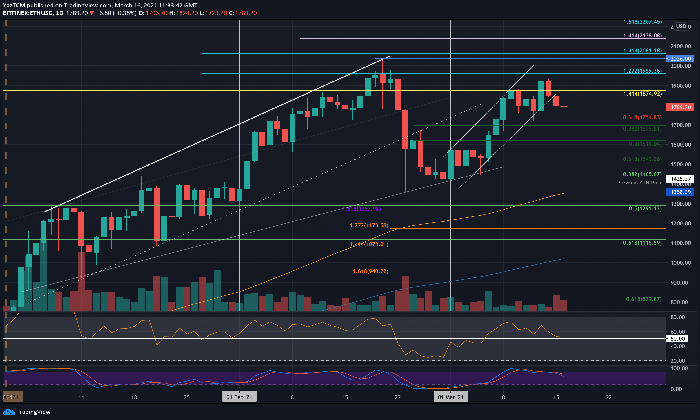
The Ethereum price has been a focal point for investors, particularly following significant shifts in market sentiment. Currently priced at $2,070, Ether’s recent weekly close marks the lowest it has seen since November 2023. This decline, amounting to 51% over the past 83 days, has prompted discussions around the potential for a price bottom to form. Those tracking Ethereum’s price trends note that such fluctuations are not uncommon in the cryptocurrency market, which often sees sharp rises followed by drastic corrections.
As investors navigate through this turbulent environment, understanding the factors that contribute to Ethereum’s price movement becomes essential. Key indicators like the 200-day EMA (Exponential Moving Average) have historically provided insights into potential reversals. With Ether currently trading below this crucial level for the first time in a significant period, market analysts are closely watching for signals of recovery or further declines.
Potential Impacts of Ethereum Outflows
Ethereum outflows have surged recently, hitting an astounding $1.8 billion in just one week, according to IntoTheBlock. This marks the largest outflow since December 2022, suggesting that many investors are choosing to move their ETH off exchanges, potentially in anticipation of price recovery. Such movements often illustrate investor sentiment, indicating that while some are worried about price drops, others may see current levels as an opportune time for buying.
The implications of such significant outflows can be profound. When large amounts of ETH are moved off exchanges, it often reflects a belief that the asset may face upward potential in the near future. Coupled with the falling MVRV ratio—which indicates undervaluation—this could suggest a buying opportunity. Investors keen on Ethereum will want to consider these factors in their analysis and decision-making processes.
Identifying Key Buying Opportunities in Ethereum
The current market conditions may present a unique buying opportunity for investors in Ethereum. With the MVRV ratio dropping below 1, it signals that the market value of Ether is lower than its realized value, indicating that Ether is potentially undervalued at present levels. Historical data shows that similar situations have often preceded bullish reversals, allowing astute investors to capitalize on lower prices before an upward price movement commences.
Many technical analysts, including figures like Mikybull, are starting to see signs of a possible bullish reversal. The indicators such as the diamond price pattern suggest that a bounce back is on the horizon. If Ethereum can reclaim the key $2,600 level post-correction, it would further solidify the notion of a profitable entry point for buyers who are currently evaluating their options in the crypto space.
Ethereum’s Recovery from Recent Lows
Investors are keen on understanding if Ethereum’s current price level signifies a bottom. With the currency hovering near the psychological barrier of $2,000, many are analyzing patterns for signs of recovery. Historical performance shows that recovering above the 200-day EMA is critical for confirming a price bottom. Prolonged trading under this indicator could lead to further price weakness; thus, all eyes are on the upcoming weekly close.
The upcoming price action will be telling. If Ether manages to close above the 200-day EMA, it could signal that the market sentiment is shifting, drawing more interest from buyers. On the flip side, continued pressure below this threshold could indicate deeper corrections ahead, challenging the notion that buyers should act now. Stakeholders should continuously monitor Ethereum’s performance in the coming weeks to gauge the overall market direction.
The Role of Long-Term Investors in Ethereum’s Future
Long-term investors have historically played a critical role in shaping Ethereum’s price trajectory. As the current market sees substantial outflows, many investors appear to be thinking strategically about their positions. By moving their assets off exchanges, they are potentially preparing for a future where Ethereum regains its value, thereby reducing selling pressure in the short term.
Such actions from long-term holders often provide a stabilizing effect on Ethereum’s market. In times of growing volatility, it is these investors who may help cushion the effects of rapid price declines by holding strong during market corrections. As Ether’s price remains unpredictable, maintaining a well-informed approach by observing long-term on-chain behavior can aid in making strategic decisions.
Technical Indicators to Watch for Ethereum
Technical analysis remains a vital tool for assessing the potential direction of Ethereum’s price. By considering indicators such as the weekly Moving Averages and the Relative Strength Index (RSI), investors can glean insights into possible future movements. For instance, a turnaround above previous resistance levels can serve as a bullish signal and attract more buying interest in the market.
That said, caution is necessary, especially with the recent closure below the key resistance zones. Traders and investors should keep a close watch on these technical indicators as they develop. They can often preemptively indicate whether market sentiment is shifting towards bullish or bearish trends, offering significant insight into when to enter or exit positions.
What Market Sentiment Means for Ethereum Prices
Market sentiment is an elusive yet critical factor influencing the price of Ethereum. As negative sentiments dominate the landscape, measured by data on ETH outflows and declining prices, it becomes imperative for investors to gauge public perception carefully. Tracking social media trends and sentiment analytics can provide additional layers of data for understanding market dynamics.
Being aware of the broader context around Ethereum price can prepare investors for possible volatility. If a positive shift in sentiment occurs due to favorable news or bullish technical indicators, it might spark renewed interest and purchasing momentum. Conversely, sustained negative sentiment can further pressure prices, making it crucial for investors to remain vigilant.
The Importance of Conducting Ethereum Analysis
Conducting regular Ethereum analyses becomes indispensable in navigating the crypto landscape. With drastic fluctuations in price and investor sentiment, continuous monitoring of price movements, ETF outflows, and the broader economic environment can equip traders and long-term holders alike with the information needed to make educated decisions regarding their investments.
Furthermore, utilizing both fundamental and technical analyses will provide a holistic view of Ethereum’s landscape, including understanding ETH’s market cap trends, trading volumes, and overall market sentiment. By merging these insights, investors can better identify potential entry points, which aligns with the notion of seeing current prices as valuable buying opportunities.
Future Predictions for Ethereum Prices
Market predictions for Ethereum are varied, with many analysts weighing in on future price projections based on a mix of technical indicators and fundamental developments. While recent outflows may signal a bottom, the uncertainty of global economic factors and regulatory pressures can complicate forecasts. Investors interested in the long-term success of Ethereum should consider these facets as part of their decision-making process.
Continuing to assess news regarding Ethereum upgrades, changes in network activity, and fluctuations in ETH supply will also be critical. Longer-term projections might lean towards recovery and growth should Ethereum successfully navigate current challenges. Maintaining awareness of both local and global market sentiments will serve investors well as they strategize their entry and exit points in the ever-changing landscape.
Frequently Asked Questions
What is the significance of recent Ethereum price movements and potential bottom indicators?
Recent Ethereum price movements highlight a potential bottom as Ether (ETH) has experienced a substantial drop of 51% over the past 83 days, closing at $2,070. Important indicators like the surge in ETH outflows, which reached $1.8 billion—the highest since 2022—along with an MVRV ratio below 1 suggest that Ethereum might be undervalued, indicating a possible buying opportunity for investors.
How do ETH outflows signal a potential price bottom for Ethereum?
The significant ETH outflows of $1.8 billion observed this past week indicate a bullish sentiment among long-term holders despite current market pessimism. This influx of ETH leaving exchanges suggests that investors believe the Ethereum price is nearing a bottom, viewing it as an optimal time to buy.
Why is the $2,000 level critical for determining the Ethereum price bottom?
The $2,000 level is psychologically important for Ethereum as it represents a key support zone. Current trading patterns show Ether consolidating around this level. For Ethereum to confirm a price bottom, it must reclaim and maintain above this threshold, ideally recovering above the 200-day EMA, which has historically indicated bullish trends.
What does the Market Value to Realized Value (MVRV) ratio indicate about Ethereum’s valuation?
The MVRV ratio for Ethereum has recently dropped to 0.8, suggesting that Ethereum is undervalued at its current price. Historical data shows that when the MVRV ratio reaches this level, it often indicates a local bottom, as seen previously when Ether rebounded significantly after similar drops.
What technical analysis patterns are emerging that could signal a bottom for Ether prices?
Technical analysts have noted a diamond price pattern forming on Ethereum’s charts, which typically implies a bullish reversal following a downtrend. This pattern suggests that if Ether can confirm a breakout, prices could rebound by approximately 20% from current levels, potentially reaching around $2,600.
How long can Ethereum prices remain below the critical EMA levels before signaling trouble?
Ethereum has historically remained below the 200-day EMA for less than 15% of the time since 2020. If ETH continues trading below this level for an extended period, it could indicate further declines in price and push the potential bottom target lower. Thus, recovery above the EMA trendline within the next few days is crucial.
Should investors consider current Ethereum price levels as a buying opportunity?
Current Ethereum price levels, which reflect significant outflows and a low MVRV ratio, may indeed present a strategic buying opportunity. However, potential investors should conduct thorough research and assess market trends as conditions can change rapidly.
| Key Point | Details |
|---|---|
| Ethereum Outflows Spike | Ethereum saw outflows of $1.8 billion, the largest since December 2022. |
| Current Price Point | Ether (ETH) is currently priced at $2,070, marking its lowest weekly close since November 2023. |
| MVRV Ratio Insights | The MVRV ratio dropped to 0.8, indicating potential undervaluation and a buying opportunity. |
| Technical Analysis Signals | Bullish reversal observed with a diamond price pattern; potential target of $2,600. |
| EMA Indicator Levels | ETH closed below the 200-day EMA for the first time since October 2023; recovery above this level is critical for confirming a bottom. |
Summary
The Ethereum price bottom remains a focal point among investors, especially as ETH experiences significant outflows. With Ethereum’s MVRV ratio indicating undervaluation and the recent bullish patterns suggesting potential reversal, there is optimism for a recovery. However, to firmly establish the bottom, it is essential for the price to reclaim the key EMA levels. Thus, the coming weeks will be pivotal in determining the trajectory of the Ethereum market.
Ethereum price bottom discussions have intensified as the cryptocurrency market faces significant fluctuations. Recently, a staggering $1.8 billion worth of ETH left exchanges, marking the largest outflow since 2022, signaling that many investors may perceive current prices as a strategic buying opportunity. At around $2,070, Ethereum’s weekly close is its lowest since November 2023, showcasing a 51% decline over the past 83 days. Analysts emphasize the importance of reclaiming the key weekly EMA level for confirming this potential bottom. As crypto news circulates, the focus on Ethereum analysis continues to reveal intriguing trends and insights about investor behavior and future price movements.
In the ever-evolving landscape of digital assets, the concept of a potential Ethereum bottom is gaining traction among enthusiasts and investors alike. Recent statistics reveal that ETH saw unprecedented outflows, with over $1.8 billion exiting exchanges, indicating a shift in market sentiment. Currently priced around $2,070, Ethereum has faced substantial challenges, reflecting a significant downturn from its previous highs. This moment has sparked increased interest in strategic entry points, as many view these price levels as ripe for investment. Overall, the ongoing analysis of ETH’s performance sheds light on broader market dynamics and the opportunities available for savvy traders.