Ripple price analysis reveals a critical juncture for XRP as it recently faced a rejection at the pivotal 100-day moving average of $2.5, triggering a notable price correction. This downturn, however, has brought XRP closer to an essential convergence of key support levels, including the 0.5 Fibonacci retracement at $1.9 and the 200-day moving average at $1.7. The current assessment highlights these supportive zones as probable catalysts for XRP consolidation in the medium term. As cryptocurrency analysis suggests, the presence of multiple support indicators reinforces buying interest in this price range, potentially offering a buffer against further declines. Investors are keenly observing these Ripple technical indicators to gauge the possibilities of strategic entry points as the market stabilizes.
In the realm of digital assets, an examination of Ripple’s movement unveils vital insights into XRP’s trajectory. Recent trends indicate that this altcoin has encountered substantial resistance at strategic technical thresholds, specifically the 100-day moving average. With the price currently nearing a cluster of robust support zones, such as the Fibonacci levels and moving averages, a phase of price steadiness seems plausible. Market analysts are now closely monitoring whether this critical support will foster a rebound or lead to further volatility. As Ripple’s indicators signal potential consolidation, traders are fortified with the knowledge necessary for informed decision-making.
Ripple Price Analysis: Understanding Recent Trends
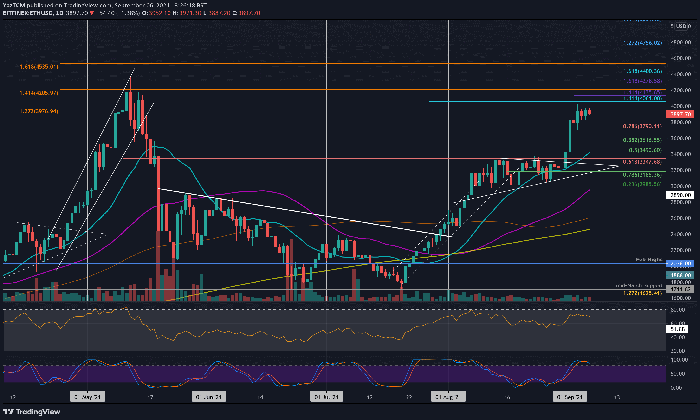
Ripple (XRP) has recently encountered significant fluctuations, characterized by its rejection at the 100-day moving average of $2.5. This price point acted as a crucial resistance level, leading to a notable decline. However, XRP is now approaching a critical support zone, where the price has consolidated. This region includes strategic levels such as the 0.5 Fibonacci retracement at $1.9 and the 200-day moving average at $1.7. The convergence of these technical indicators suggests that buyers are stepping in, increasing the likelihood of a bounce back in the near term.
Analyzing the price action indicates a strong demand around these support levels, providing a foundation for potential recovery. If XRP can maintain stability above the identified support, it is likely we will see a consolidation phase that could set the stage for future bullish momentum. Traders and investors should closely monitor these levels and the corresponding volume trends, as they can provide insights into whether XRP will rally or continue its current bearish trajectory.
XRP Price Prediction: What Lies Ahead?
XRP price predictions remain a focal point for traders and analysts as the market navigates through these challenging phases. Analysts are currently investigating the likelihood of XRP consolidating or staging a recovery given the recent drop. If XRP can hold firm above the crucial Fibonacci level at $1.9, expectations are that it could initiate a short-term bullish trend. With various technical indicators supporting this outlook, many believe that a favorable trend may be on the horizon, especially with a confirmed support level at $1.7.
However, it’s essential to remain vigilant regarding broader market sentiment, as cryptocurrency often mirrors movements in Bitcoin and Ethereum. If a market-wide downturn occurs, XRP may struggle to find traction, but should the overall sentiment improve, XRP could break through its resistance levels. Hence, consistent updates and thorough technical analysis are critical for making informed predictions regarding XRP’s future price movements.
Ripple Support Level Analysis: Key Zones to Watch
The analysis of Ripple’s support levels is paramount for understanding potential price movements. As XRP approaches the aforementioned support zones, including the crucial 0.5 Fibonacci retracement level and the 200-day moving average, traders should remain cautious yet optimistic. These levels historically act as strong barriers against downward price action—evidence that can be seen in past price fluctuations. Thus, monitoring these support levels is vital for traders looking for opportunities to enter the market.
Moreover, the presence of multiple technical indicators aligning at these critical support zones reinforces the notion that they may act as a substantial safety net for XRP. Should the price dip below these levels, it could signal further bearish pressure, prompting investors to reevaluate their positions. Therefore, keeping a sharp focus on these support levels and how they interact with market dynamics can greatly influence both trading strategies and XRP’s overall price direction.
XRP Consolidation: Analyzing Market Dynamics
XRP’s potential consolidation is a key subject of analysis as the cryptocurrency approaches crucial support levels. Observing the recent price action, we can discern that after hitting resistance at $2.5, XRP has retraced to a more stable zone, marking a phase where buyers and sellers may find common ground. This consolidation period often indicates a market pause, allowing traders to assess the next potential move. It reflects a balance in supply and demand, particularly when aligned with significant support zones.
Furthermore, the consolidation phase is often characterized by lower volatility, which can be a precursor to stronger price action in either direction. Therefore, during this period, Ripple’s technical indicators will be pivotal in determining future trends. Traders should monitor XRP’s trading volume and price movements closely to identify signs of a breakout or further declines, as these patterns often precede major shifts in market sentiment.
Cryptocurrency Analysis: The Case for Ripple
In the broader cryptocurrency landscape, Ripple stands out for its unique technological features and strategic partnerships within banking and financial services. Cryptocurrency analysis focusing on XRP emphasizes its potential to facilitate cross-border payments efficiently, positioning it as a viable alternative in the digital asset market. Recent trends show that despite temporary setbacks, interest in XRP remains strong among institutional investors, which could signal a bullish outlook.
Moreover, this period of XRP’s activity offers valuable insights into the overall cryptocurrency market’s behavior. Analyzing Ripple against other major assets can reveal critical correlations and market trends, essential for making informed trading decisions. As XRP undergoes phases of consolidation and resistance, these insights can help delineate not just Ripple’s potential directions but also strategies for managing risks in the current market volatility.
Ripple Technical Indicators: Decoding the Market Signals
Technical indicators serve as vital tools for traders seeking to understand the dynamics of Ripple’s price movements. Current analysis of XRP highlights several key indicators, such as the 100-day moving average and Fibonacci retracement levels, which play crucial roles in identifying potential entry and exit points. These indicators have provided crucial insights into market sentiment and may indicate whether Ripple is positioned for recovery or further decline.
Traders often rely on these technical indicators to guide their strategies, particularly during periods of high volatility or uncertainty. Understanding the context of these indicators within Ripple’s price history can lend clarity to future predictions. Thus, continuous monitoring of these technical benchmarks is essential for any trader looking to optimize their positions in the challenging cryptocurrency landscape.
Market Sentiment Impacting Ripple’s Price Movements
Market sentiment plays a pivotal role in shaping the price movements of Ripple and other cryptocurrencies. Negative sentiments triggered by external factors, such as regulatory news or broader economic conditions, can lead to rapid sell-offs and price declines, as evidenced by XRP’s recent rejection at critical resistance levels. Conversely, a positive market outlook can invigorate buying pressure, leading to significant price recoveries.
As Ripple navigates its current challenges, understanding the factors that influence market sentiment becomes crucial for traders. Utilizing tools like sentiment analysis can provide insights into collective investor emotions and help gauge the psychological barriers that may impact price movements in the near future. By staying attuned to both market news and technical signals, traders can make more informed decisions regarding their Ripple investments.
The Future of Ripple in the Cryptocurrency Ecosystem
As Ripple continues to evolve amid regulatory scrutiny and market challenges, its future within the cryptocurrency ecosystem remains a hot topic of discussion. Analysts are weighing the pros and cons of Ripple’s enhanced technological capabilities and its strategic aim to facilitate faster and cheaper cross-border transactions. Even with recent price fluctuations, many industry experts argue that Ripple’s long-term viability remains strong, primarily due to its innovative approach to addressing existing payment system inefficiencies.
Looking ahead, the trajectory of Ripple could be significantly shaped by its ability to secure partnerships and adapt to regulatory frameworks. Consequently, investors need to stay informed about Ripple’s developments and how they influence the wider adoption of cryptocurrencies. As the market matures, Ripple’s position may solidify, leading to increased adoption by financial institutions, which could reinforce its value proposition and stability in the long run.
Frequently Asked Questions
What are the key factors impacting the recent Ripple price analysis?
The recent Ripple price analysis indicates that XRP faced significant selling pressure at the 100-day moving average of $2.5. This rejection has led to a retracement towards critical support levels, including the 0.5 Fibonacci retracement at $1.9 and the 200-day moving average at $1.7.
How does the current XRP price prediction look in light of recent market trends?
The current XRP price prediction suggests a potential consolidation phase as the price approaches key support levels. Should XRP maintain its position above the critical support around $1.9, it could stabilize before its next move, making this analysis crucial for traders.
What is the significance of the Ripple support level at $1.9 for XRP traders?
The Ripple support level at $1.9 is significant because it acts as a crucial barrier against further declines. This level, along with the 200-day moving average, represents strong demand in the market and could lead to a consolidation phase, thus determining future price action.
Can we expect XRP consolidation in the near future based on current trends?
Yes, based on the current trends observed in the XRP price analysis, it is anticipated that XRP will enter a consolidation phase as it approaches key support levels. This trend suggests a stabilization around the $1.9 level, which has historically served as strong support.
What role do Ripple technical indicators play in analyzing XRP’s movement?
Ripple technical indicators, such as the 100-day and 200-day moving averages, provide insight into the asset’s momentum and trend. Currently, the rejection at the 100-day MA at $2.5 and convergence to support levels indicate a potential bearish trend reversal or stabilization.
| Key Point | Details |
|---|---|
| Rejection at 100-Day MA | Ripple faced rejection at the 100-day moving average priced at $2.5, which caused a significant decline in price. |
| Support Zones Convergence | Ripple is approaching key support zones, including the 0.5 Fibonacci retracement level ($1.9) and the 200-day moving average ($1.7). |
| Potential Consolidation | The convergence of these support levels suggests that a consolidation phase is likely, which may strengthen the price against further declines. |
| Bearish Momentum | Recent bullish momentum was weak, leading to downward pressure as the price moved closer to the lower boundary of the descending wedge. |
| Critical Level to Watch | The price level of $1.9 is crucial; failing to hold above it could cause further drops, but consolidation is expected before the next significant price action. |
Summary
Ripple price analysis indicates a critical juncture as the cryptocurrency faces potential consolidation after recent declines. Following a rejection at the 100-day moving average of $2.5, Ripple is now approaching vital support zones such as the 0.5 Fibonacci retracement at $1.9 and the 200-day moving average at $1.7. These levels are essential for maintaining support in the face of bearish momentum. Should Ripple successfully consolidate above these levels, it could set the stage for a recovery. Monitoring these support zones will be crucial in the upcoming trading sessions.
Ripple price analysis indicates a notable shift in market dynamics as XRP recently faced significant resistance at the critical 100-day moving average of $2.5. This rejection has led to a downward price movement, but the asset is now nearing crucial support levels that may encourage consolidation in the coming period. According to expert speculation and XRP price prediction models, these support zones—especially the 0.5 Fibonacci retracement at $1.9 and the 200-day moving average at $1.7—highlight strong demand. As investors closely monitor Ripple technical indicators, the convergence of these key support levels provides a potential safety net against further declines. With such factors at play, the cryptocurrency analysis suggests that XRP may stabilize, offering interesting opportunities for traders looking to capitalize on price action.
The assessment of Ripple’s market performance reveals a compelling scenario for XRP holders and traders alike. Following an unsuccessful attempt to breach the $2.5 threshold, Ripple is pivoting towards significant support zones that may dictate its next movements. Observers in the cryptocurrency field are analyzing various technical elements, such as the recent price retracement patterns and the likelihood of XRP consolidation. The importance of these support levels cannot be overstated, as they reflect where buying interest could emerge and possibly shift market sentiment. Given these factors, Ripple’s trajectory remains a hot topic among cryptocurrency enthusiasts who actively seek insights into potential price forecasts.