BNB price analysis reveals a bullish trend as the cryptocurrency demonstrates resilience and upward momentum. Recently, the price found strong support around the $550 mark, allowing for a recovery that pushed it above key resistance levels. Indicators suggest that if BNB can maintain itself above $588, there is potential for further gains, possibly leading to bullish targets near $635. An astute analysis of BNB resistance levels shows significant activity at the $606 and $616 thresholds, which could determine the cryptocurrency’s next movement. As traders and investors closely monitor BNB technical indicators, the outlook remains cautiously optimistic for those looking at BNB price prediction.
Examining the current landscape of Binance Coin, one can observe a robust improvement after the recent downturn. The currency has been rebounding from a pivotal support zone, positioning itself for possible increases. Market participants are keenly watching the dynamics of BNB support levels that play a critical role in protecting against sharp reversals. With various cryptocurrency analyses highlighting potential resistance zones, the focus also falls on the emerging patterns formed by BNB technical indicators. As the situation continues to unfold, BNB enthusiasts remain hopeful for a favorable shift in price action.
BNB Price Analysis: Current Trends and Projections
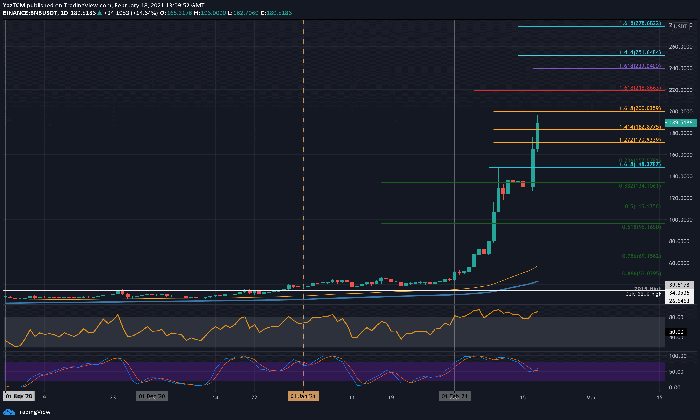
The current BNB price analysis indicates that the cryptocurrency is showing signs of recovery after finding strong support around the $550 mark. This upward movement has allowed BNB to surpass significant resistance levels of $565, $570, and even $588, thus setting the stage for a potential surge. The price is actively moving above the $600 level, aided by a supportive bullish trend line that appears on the hourly charts. This trend suggests a robust bullish sentiment in the market, making BNB one of the standout performers compared to peers like Ethereum and Bitcoin.
As the market looks ahead, one critical point of interest is the $635 resistance level, which could become a target for traders if the bullish momentum continues. The presence of a bullish scenario becomes more tangible if BNB can break past the $616 zone, corresponding with a significant Fibonacci retracement level. Should this occur, we may see BNB’s price extend towards the next psychological resistance at around $650, thereby creating opportunities for profitable trades in the cryptocurrency space.
BNB Resistance and Support Levels: A Detailed Examination
In the realm of cryptocurrency analysis, understanding resistance and support levels for BNB is crucial for traders and analysts alike. Currently, key resistance is observed at $606, where the price has faced challenges despite efforts to surge higher. This level is pivotal as it acts as a barrier to continued upward movement. Should BNB manage to break above this resistance, it could pave the way toward testing the next level at $616, which aligns with both technical indicators and Fibonacci retracement points.
On the downside, critical support levels have established a safety net for BNB as it navigates these price fluctuations. The $600 level serves as the initial support, with further crucial support sitting at $595 and a more substantial level at $588. A decline below this key level could trigger a more pronounced downturn, potentially seeing the price decline toward the $570 mark. Therefore, it is essential for traders to keep a close eye on these support and resistance levels to inform their trading strategies effectively.
Key Technical Indicators for BNB Traders
When performing a detailed technical analysis of BNB, various crucial indicators play a significant role in decision making. The Hourly MACD (Moving Average Convergence Divergence) is currently reflecting a bullish momentum, indicating that buying pressure may continue to build. This is buoyed by the RSI (Relative Strength Index) remaining above the 50 level, suggesting that the BNB price is in a strong bullish territory, further substantiating the expectation for potential price increases.
In addition to the MACD and RSI, traders often consider the positioning with respect to major moving averages. BNB is currently trading just below the 100-hour simple moving average, which could act as a resistance point if the price fails to break through. Continuously monitoring these technical indicators can provide insights into possible price movements and help traders anticipate shifts in momentum, enabling more informed trading decisions in the volatile cryptocurrency landscape.
BNB Price Prediction: Future Expectations
In terms of BNB price prediction, analysts remain cautiously optimistic regarding the cryptocurrency’s trajectory in the short to medium term. With the ongoing bullish trend supported by the recent recovery above the $550 zone, there is a consensus that BNB could test higher price levels, potentially reaching $635 in the upcoming trading sessions. The market dynamics appear favorable as BNB continues to show resilience against significant downturns, particularly if it maintains its standing above critical support levels.
However, as with any cryptocurrency, external factors such as market news, regulatory changes, and investor sentiment can heavily influence price predictions. Technical factors, combined with the overall market environment, will play a vital role in shaping BNB’s future price action. It remains essential for traders and investors to stay alert to new developments while regularly updating their forecasts based on the most recent technical analysis.
Trading Strategies for BNB Investors
For investors looking to capitalize on BNB’s price movements, implementing sound trading strategies becomes paramount. As the price fluctuates around key levels, employing strategies such as trend following could prove beneficial. This involves identifying bullish periods—like the current one—and taking positions that align with the upward momentum. Traders may benefit from setting stop-loss orders just below crucial support levels to minimize losses should the market take an unexpected turn.
Additionally, employing a framework based on Fibonacci retracement can assist traders in determining optimum entry and exit points. By leveraging these technical tools, coupled with a solid grasp of price action, investors can enhance their profitability in BNB trading. Continually refining these strategies based on market developments and performance will ensure traders remain positioned advantageously in the shifting landscape of cryptocurrency.
Market Sentiment: BNB in the Cryptocurrency Landscape
Market sentiment plays a pivotal role in the trading of cryptocurrencies, including BNB. Currently, sentiment appears to be leaning towards a bullish outlook as BNB demonstrates a strong recovery from its recent lows. Such feelings among investors can contribute to increased buying pressure, further driving the price upwards in tandem with technical indicators that support a positive momentum shift.
Moreover, comparing BNB’s performance relative to other cryptocurrencies reveals its potential market position. Recently, BNB has been outperforming major players such as Ethereum and Bitcoin, fostering confidence among investors. Positive market sentiment not only propels trading volumes but also influences BNB’s price dynamics, showcasing the psychological aspects that often drive trading behaviors in the cryptocurrency sector.
Risk Management: Navigating BNB Volatility
Navigating the volatility of BNB requires robust risk management strategies, especially with the ever-shifting nature of cryptocurrency markets. Given the substantial price movements that may occur near the critical resistance levels of $606 and $616, traders must exercise caution and implement risk mitigation techniques. This includes diversifying their investment portfolios to reduce exposure to any single asset and using stop-loss orders to protect against unexpected downturns.
Effective risk management also involves continually assessing one’s investment strategy in alignment with evolving market conditions. As BNB’s price fluctuates, what works today may not be viable tomorrow. Therefore, remaining adaptable and ready to re-evaluate positions in response to market changes will help traders safeguard their investments while seizing new opportunities as they arise.
BNB Market Analysis: Influential Factors
Understanding the myriad factors affecting BNB’s market performance is crucial for traders and analysts alike. One significant influence is the overall market trend, with Bitcoin often dictating the movements of other cryptocurrencies. When Bitcoin experiences volatility, it can ripple through the crypto space, affecting BNB’s price action. Additionally, developments within the Binance ecosystem, such as new projects or collaborations, could positively impact BNB’s market sentiment and subsequent price movements.
Moreover, advancements in DeFi (Decentralized Finance) and innovative use cases within the Binance Smart Chain can bolster demand for BNB, as more users seek to utilize its potential across various applications. Monitoring these external factors provides a comprehensive lens through which to assess BNB’s future price trajectories and informs better trading decisions.
BNB vs Competitors: Comparative Performance Review
When evaluating BNB’s performance relative to its competitors in the cryptocurrency market, it becomes evident that its upward trajectory is noteworthy. Outperforming major cryptocurrencies like Ethereum and Bitcoin over recent weeks indicates a resilient market position for BNB. Such comparative performance can encourage market interest and instigate bullish trading patterns among investors looking to capitalize on BNB’s apparent strength.
Another essential aspect to consider is the adopted strategies by competing cryptocurrencies. If competitors are not able to keep pace with technological upgrades or market expansions, BNB could solidify its position as a leading token. As momentum builds, trading strategies that focus on comparative performance metrics could yield significant insights, allowing investors to make informed decisions in a dynamic market.
Frequently Asked Questions
What is the current outlook for BNB price analysis?
The current outlook for BNB price analysis is bullish as the BNB price is recovering from the $550 support and is trading above key resistance levels. The recent price movements suggest potential growth towards the $635 resistance if it maintains above the $588 support level.
What are the key resistance levels in BNB price prediction?
In the latest BNB price prediction, key resistance levels are identified at $606 and $616. Breaking through the $616 resistance could trigger a surge towards the $635 target.
How are BNB’s support levels affecting its price movements?
BNB’s support levels play a critical role in its price movements. Currently, support is observed at $600 and $588. If the price falls below the $588 level, it could signal a downtrend towards $570.
Which technical indicators are essential for BNB price analysis?
For effective BNB price analysis, key technical indicators include the Hourly MACD, which shows bullish momentum, and the RSI, currently above 50 indicating positive price action. These indicators help traders gauge future BNB price movements.
What should BNB holders watch for in the near term based on BNB technical indicators?
BNB holders should monitor the $606 resistance closely, as a failure to break through could initiate a decline. Additionally, maintaining above the $588 support level is crucial for further upward momentum in BNB price analysis.
What does the BNB price analysis suggest about potential gains?
Recent BNB price analysis suggests that if the price clears resistance at $616, it could gain traction towards $635 and possibly test $650 in subsequent movements. Therefore, traders should stay alert for signs of continued bullish momentum.
How did BNB perform against other cryptocurrencies in recent price movements?
In recent price movements, BNB outperformed major cryptocurrencies like Ethereum and Bitcoin, suggesting strong bullish sentiment and recovery as it moved above key levels post the $550 support.
What trends can be identified in the current BNB price analysis?
Current BNB price analysis indicates a bullish trend as the price recovers above significant support levels. A forming bullish trend line on the hourly chart further supports this positive outlook.
What is the significance of the Fibonacci retracement levels in BNB price analysis?
Fibonacci retracement levels are significant in BNB price analysis, providing key points for potential resistance and support. For instance, the 76.4% level at $616 is crucial for predicting further price increases.
What risks should investors consider based on the BNB price analysis?
Investors should consider risks such as the potential decline if BNB fails to break the $606 resistance. A drop below the $588 support could lead to further losses, pointing towards significant support at $570.
| Key Point | Details |
|---|---|
| Current Price Action | The BNB price is recovering from the $550 support zone, aiming for $635 resistance. |
| Resistance Levels | Immediate resistance at $606, next resistance at $616, and potential test at $635. |
| Support Levels | Key support levels are $600 and $588. |
| Technical Indicators | MACD is bullish; RSI is above 50 indicating strength. |
| Market Sentiment | Price is outperforming Ethereum and Bitcoin, showing bullish momentum. |
Summary
BNB price analysis shows that the cryptocurrency is showing signs of recovery, bouncing back from a solid support level at $550. With a possible bullish trend forming and a current price above $600, there is an optimistic outlook for BNB as it aims for higher resistance levels. If the price maintains above the $588 key support, it could initiate further increases toward $635 and potentially beyond, offering traders exciting opportunities in the market.
In the ever-evolving world of crypto, the latest BNB price analysis reveals an intriguing recovery trend from the significant $550 support zone. Currently, BNB is aiming for a bullish breakout, possibly targeting the $635 resistance level, amid notable movements above key milestones like $585. As traders closely monitor BNB resistance levels and optimistic projections surface, the implications of these price fluctuations become clearer. Furthermore, BNB price prediction models indicate potential upward movement, especially with technical indicators showing positive momentum. By understanding these trends and the associated cryptocurrency analysis, investors can better navigate BNB’s fluctuating landscape and position themselves strategically.
Exploring the dynamics of Binance Coin’s price developments offers insights into the broader cryptocurrency market. Recent observations suggest that BNB is not merely bouncing off its lows but is poised for upward momentum as it approaches critical thresholds. Participants in the crypto space are particularly focused on what the latest trends in BNB’s support and resistance levels indicate for future movements. Analyzing BNB’s present performance through various technical indicators can shed light on potential price trajectories in the coming weeks. As BNB continues to gain traction, observers are keen to see whether it can sustain its newfound momentum.