XRP price analysis reveals significant movements in the cryptocurrency market, particularly as XRP faces a crucial support level this week. After several consecutive bearish candles have characterized its daily performance, traders are closely monitoring the pattern formed around its symmetrical triangle. This technical analysis highlights potential breakout or breakdown scenarios that could shape XRP’s immediate future. Market trends suggest that XRP’s trading volume will play a key role in determining whether the cryptocurrency can build bullish momentum or if it will continue its downward trajectory. As investors sift through cryptocurrency market trends, understanding XRP price dynamics is essential for making informed trading decisions.
Analyzing the price movements of XRP offers valuable insights into current market dynamics, especially as it nears an important support threshold. Traders and analysts are particularly focused on the triangular price formation, which serves as a visual representation of the battle between buyers and sellers. The outcome of this interaction could either lead to a significant rally or signal further declines for XRP. Given the increasing scrutiny on the trading activities and volume related to this cryptocurrency, understanding these factors is vital for effectively navigating the volatile landscape of digital currencies. Observations from recent market patterns underscore the importance of these technical indicators in predicting future price action.
XRP Price Analysis: Current Trends and Future Implications
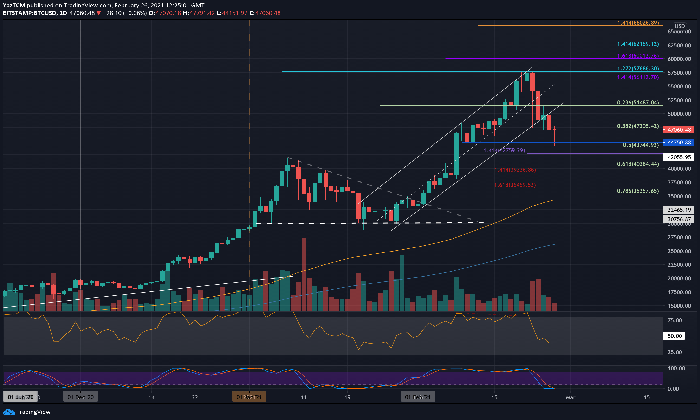
The recent XRP price analysis shows a persistent downward movement, as the cryptocurrency struggles to maintain momentum in the current bearish market. Since the beginning of the week, there has been a continual decline, represented by multiple bearish candles on the daily timeframe, which indicates sustained selling pressure. At the heart of this price drop lies a critical support level, currently being tested as XRP approaches the lower boundary of a symmetrical triangle pattern. This technical setup could be pivotal for XRP’s price action, as it threatens to either initiate a rebound or lead to a further decline.
With XRP trading around $2.18, traders are closely monitoring this support level for any signs of strength. A breakdown could spell trouble, pushing the price to test new lows around $2. Conversely, if buyers step in to defend the support, we may witness a bullish reversal back towards the upper part of the symmetrical triangle. The ongoing XRP trading volume will play a crucial role in this scenario, as low volumes during a bounce could indicate a lack of conviction, risking a false breakout. Thus, clear observances of volume alongside price movements will be essential for predicting XRP’s short-term trajectory.
Understanding the Symmetrical Triangle Pattern in XRP
The symmetrical triangle pattern forming in XRP’s daily chart has garnered significant attention from traders and analysts alike. This chart pattern is characterized by converging trendlines created by a sequence of lower highs and higher lows, signaling uncertainty in market direction. As such, XRP’s current interaction with the lower trendline is critical; it acts as a decisive point that could dictate the next major move for the cryptocurrency. Traders often look for confirmation of the pattern through volume spikes, as they indicate the market’s intention, whether to buy or to sell, at these crucial junctures.
Analysts highlight that the base support of the symmetrical triangle has been tested multiple times without sustaining a significant breakdown, each retest resulting in slight upward bounces. However, this repetition of tests could lead to a high risk of a breakdown if bearish pressure continues to mount. A sustained drop below this triangle support could lead to increased selling momentum, prompting stop-loss orders to trigger beneath this critical level. Thus, understanding the dynamic within this symmetrical triangle is key for traders seeking to navigate XRP’s potential price shifts over the coming days.
Impacts of Cryptocurrency Market Trends on XRP
Current cryptocurrency market trends indicate a strong bearish sentiment, which has a cascading effect on XRP’s price movements. As Bitcoin and Ethereum face their own challenges, the overall market has entered a correction phase that particularly affects altcoins like XRP. Market-wide sell-offs often lead to decreased trading volumes and increased volatility, compelling traders to rethink their long and short positions. For XRP, an analysis of broader market dynamics is essential, as they can directly influence trader sentiment and price action.
The potential for XRP to break out of its current triangle depends not only on its individual patterns but also on the overall health of the cryptocurrency market. Improving market sentiment and upward trends in leading cryptocurrencies could bolster XRP’s chances of a rebound from its key support levels. However, persistent bearish trends could signal deeper retracements, impacting XRP further. Hence, traders must stay cognizant of cryptocurrency market trends as they directly correlate with XRP’s trading strategies and long-term investment outlook.
Trading Volume: A Key Indicator for XRP’s Future
XRP’s trading volume is a critical component in evaluating its strength at current support levels. High trading volumes tend to accompany significant price movements, whether upwards or downwards, providing confirmation of trader interest and market momentum. Currently, as XRP hovers around its lower trendline on the symmetrical triangle, the trading volume is pivotal in determining if a reversal is possible or if a breakdown is impending. Investors should observe any shifts in trading volume closely, as a low volume scenario during a bounce could indicate weak support and potential failure of any breakout.
In periods of established patterns like the symmetrical triangle, analyzing trading volume helps in shaping the future outlook for XRP. If substantial buying interest emerges, we could see the volume spike, solidifying a bullish trend. On the contrary, if selling continues with significant volumes, it may lead to substantial downturns, pushing XRP below critical support levels. Therefore, traders must remain vigilant and analyze volume trends alongside regular price patterns to gauge the likely movements in XRP’s market behavior.
Technical Analysis of XRP: Key Support and Resistance Levels
Conducting a thorough technical analysis of XRP reveals crucial support and resistance levels that traders must navigate. The current support level, associated with the lower boundary of the symmetrical triangle, offers a critical area for buy and sell decisions. Technical indicators often suggest that if current support holds, we may see a bullish reversal, moving XRP closer to its resistance level near the triangle’s upper boundary. Traders should be prepared for these price fluctuations as they present both risk and opportunity.
Furthermore, understanding XRP’s resistance levels beyond the symmetrical triangle can provide insights into potential profit-taking points for those entering into long positions. Should XRP witness an upward trend, breaking past established resistance could confirm a stronger bullish trend, whereas failure to break these levels may keep XRP trapped within its current consolidation phase. Thus, identifying and analyzing these support and resistance levels is essential for effective trading strategies.
Bearish Sentiment and Its Effects on XRP’s Pricing Structure
The current bearish sentiment surrounding XRP significantly impacts its pricing structure, leading to a series of downward adjustments. As the market faces increased pressure, the downward trend reflected in XRP’s charts signifies that the cryptocurrency is undergoing a corrective phase, which has been accentuated by consecutive bearish candles. This selling pressure results in a psychological effect among traders, prompting them to adopt more defensive trading strategies as they anticipate more declines.
As XRP grapples with this bearish outlook, the possibility of further declines raises concerns among investors. Should the price fall below established support levels, it may create a ripple effect of negative sentiment, spurring additional selling. Thus, understanding the implications of bearish activity on XRP’s pricing structure is vital for speculating on future movements and developing risk management strategies.
Market Influences on XRP: Global Economic Factors
External market influences, particularly global economic factors, play a significant role in shaping the performance of XRP. Economic events, regulatory news, and macroeconomic trends can instigate sharp price movements in cryptocurrencies. For XRP, understanding these influences is crucial, as they often correlate with significant price adjustments. Geopolitical tensions, inflation worries, and changes to financial regulations can create waves that ripple through the crypto markets, affecting XRP’s performance relative to its peers.
Furthermore, investors must remain aware of how economic indicators, such as employment rates and consumer sentiment, can indirectly impact cryptocurrency market trends, including XRP. Positive economic conditions can foster an environment conducive to investor confidence, pushing crypto prices upward, while negative indicators may cause traders to retreat from the market. Therefore, analyzing XRP in tandem with the broader economic landscape can provide valuable insights for traders looking to position themselves effectively.
Long-Term Outlook for XRP in a Volatile Market
In the context of a volatile market, establishing a long-term outlook for XRP requires a combination of technical analysis and an understanding of underlying fundamentals. As XRP faces significant resistance and support levels within the context of current market dynamics, its long-term trajectory will significantly depend on how it reacts to these technical patterns. The ongoing presence of a symmetrical triangle implies that a breakout, either upwards or downwards, could set the tone for XRP’s performance in the coming weeks and contribute to its long-term narrative.
Moreover, XRP’s integration and adoption by financial institutions and ongoing promises of utility within the blockchain space will ultimately influence investor sentiment. Sustainable price growth calls for not just technical price movements but also real-world usage and market confidence in the technology’s potential. Consequently, the long-term outlook for XRP should combine both technical analysis with a broader understanding of its applications and market acceptance.
Preparing for XRP’s Price Fluctuations: Trading Strategies
As XRP continues its trading journey within the fluctuating framework of a symmetrical triangle, devising and employing effective trading strategies becomes essential for navigating potential price movements. Traders can utilize various techniques, such as setting stop-loss orders just below support levels to mitigate risk. Utilizing technical indicators to identify entry and exit points can further refine trading strategies, enabling investors to capitalize on potential rebounds or breakouts.
In addition, diversification within cryptocurrency portfolios can help to cushion against unforeseen volatility specifically attributed to XRP’s price action. Monitoring key levels and adjusting trading strategies based on market conditions allows traders to keep an adaptive approach amidst uncertainties. Thus, having a clear plan that integrates technical analysis with market-aware strategies can enhance decision-making and optimize outcomes when engaging with XRP.
Frequently Asked Questions
What is the current trend in XRP price analysis?
XRP has been experiencing a consistent downward trend since the beginning of this past week, characterized by a series of bearish candles on the daily timeframe. This price action has directed XRP toward a critical support level that traders should monitor closely.
How does the symmetrical triangle affect XRP price analysis?
The symmetrical triangle pattern in XRP’s daily chart indicates a potential breakout or breakdown. Currently, XRP is interacting with the lower trendline of this pattern, which has been tested multiple times. This interaction suggests that a significant price movement could be imminent, influencing buyers’ and sellers’ decisions.
What role does the XRP support level play in its price analysis?
The support level for XRP is crucial in the current price analysis, as it is being tested by the price action. A successful hold at this support could lead to a rebound, while a breakdown below this level may indicate further downside pressure, marking a pivotal point for the cryptocurrency.
What should traders look for in terms of XRP trading volume during this price analysis?
Traders should pay attention to XRP’s trading volume, as it plays a vital role in confirming price movements. A bounce from the support level accompanied by strong trading volume could signal a legitimate recovery, whereas a weak bounce may result in a false breakout.
How do current cryptocurrency market trends impact XRP price analysis?
Current cryptocurrency market trends heavily influence XRP’s price analysis. With an ongoing bearish sentiment impacting many cryptocurrencies, the recovery potential for XRP may depend on broader market movements, alongside its individual technical patterns and support levels.
| Key Points | Details |
|---|---|
| Current Trend | XRP has been on a downward trend since the start of the week, facing consistent bearish pressure. |
| Support Level | XRP is approaching a crucial support level at the lower boundary of a symmetrical triangle. |
| Symmetrical Triangle | The triangle has been forming since January, reducing volatility with lower highs and higher lows. |
| Potential Outcomes | A bounce from support may lead to a rally to resistance; a breakdown could result in further decline. |
| Current Price | XRP is currently trading at $2.18, having briefly dipped below the triangle. |
| Market Sentiment | There is bullish sentiment as buying pressure has been observed at the lower boundary of the triangle. |
Summary
XRP price analysis reveals that the cryptocurrency is at a pivotal point as it approaches the lower boundary of a symmetrical triangle. With the potential for a breakout or breakdown ahead, traders should remain alert to fluctuations in buying volume and market sentiment. The upcoming days will determine if XRP can maintain this support level or succumb to further bearish trends.
XRP price analysis has become especially crucial as the cryptocurrency grapples with a notable downward trend that has persisted since the week began. With multiple days of bearish candles shaping the daily timeframe, XRP’s price is inching closer to an essential support level that traders are closely monitoring. Currently perched at the lower edge of a symmetrical triangle, the price action could either signal a deeper decline or a potential rebound in the market. As cryptocurrency market trends evolve, the importance of evaluating XRP’s trading volume cannot be overstated; it will play a pivotal role in determining the effects of any breakout or breakdown. By delving into XRP technical analysis, traders can better understand the implications of this critical juncture and plan their strategies accordingly.
In the world of digital assets, examining the trajectory of XRP’s value provides insightful perspectives for investors and enthusiasts alike. This cryptocurrency has undergone a series of fluctuations, and analyzing its patterns—particularly through the lens of a symmetrical triangle formation—could offer significant clues about its future movements. As market participants scrutinize key support levels, the dynamics of XRP trading volume will reveal whether buying interest is on the rise. Understanding these elements is essential, especially when considering the prevailing cryptocurrency market trends that impact XRP’s performance. By utilizing advanced techniques in XRP technical analysis, traders can identify opportunities and prepare for both potential bullish and bearish scenarios.


Leave a Reply