Bitcoin price analysis is crucial for understanding the ongoing movements in the cryptocurrency market, especially as BTC seeks to escape its current consolidation phase. As Bitcoin gradually inches toward the 200-day moving average, traders and investors are closely watching the key resistance levels around $88,000. The behavior of the market could lead to a pivotal breakout, potentially pushing prices towards predicted targets near $92,000 and beyond. With technical analysis Bitcoin showing both bullish momentum and higher lows in recent sessions, the sentiment could shift dramatically based on market reactions. A strong close above critical resistance will be required to ensure a sustainable rally in the near future.
Analyzing the price dynamics of Bitcoin reveals insightful trends that are shaping the future direction of this leading digital asset. Current assessments highlight the importance of monitoring BTC’s performance as it navigates through a phase of consolidation marked by strategic price levels. The implications of these trends can significantly affect the overall landscape of the cryptocurrency ecosystem, particularly with rising expectations for a breakout. Investors are keenly assessing market signals and technical indicators to anticipate potential shifts in momentum. By focusing on these aspects, stakeholders can better position themselves for the upcoming fluctuations in Bitcoin’s trajectory.
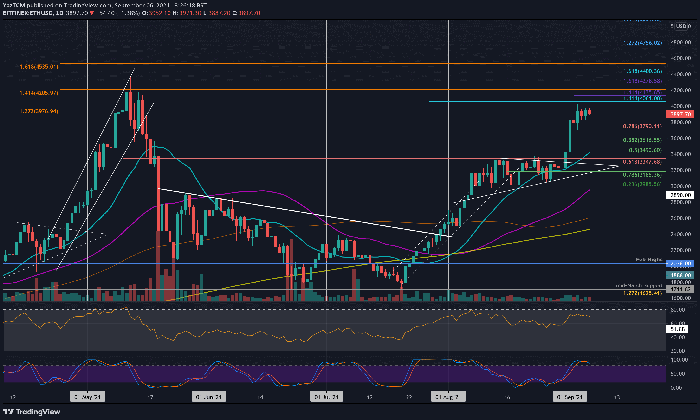
The Current State of Bitcoin Price Analysis
As of April 19, 2025, Bitcoin is experiencing a critical phase where its price is oscillating just below the 200-day moving average (DMA) at approximately $88,000. This price level is crucial as it acts not only as a dynamic resistance but also as a psychological barrier for traders in the cryptocurrency market. The performance of Bitcoin in the coming weeks will largely depend on whether it can consolidate above this threshold—an essential factor for bulls looking to target higher prices like $92,000 and $100,000. Traders should closely monitor fluctuations around this pivotal level, as it may dictate the future direction of BTC’s price action. Every move above or below this area warrants careful analysis, especially in contexts of technical analysis Bitcoin.
Moreover, the patterns observed in the daily chart further underscore the importance of the $88,000 mark. The recent price structure, which has displayed higher highs and lower lows, indicates a sharp battle between buyers and sellers in the market. With BTC still trapped within this consolidation range, the anticipation grows for a breakout that could usher in significant volatility. As Bitcoin nears these crucial price levels, the interplay between sentiment analysis and technical indicators will be integral to understanding the potential for notable upward movement or concerning rejections.
Technical Analysis: The Path Ahead for Bitcoin
In the realm of technical analysis, assessing Bitcoin’s price movements on both daily and 4-hour charts reveals crucial insights into its potential trajectory. On the 4-hour chart, Bitcoin has successfully crossed a long-term descending trendline, suggesting a shift in momentum towards bullish sentiment. However, it is currently trapped below a key supply zone between $86,000 and $88,000. This consolidation phase is vital for establishing a solid foundation for a potential breakout. Traders should be prepared for rapid price movements, especially if BTC can convincingly break above the $88,000 resistance, which could catalyze momentum toward higher price targets within the cryptocurrency market.
Furthermore, the higher highs and higher lows identified in this timeframe reinforce a bullish trend, even amid recent volatility. As the Relative Strength Index (RSI) continues to rise without reaching overbought conditions, this indicates that bullish momentum is still present. The importance of this technical setup cannot be overstated—if BTC breaks through the established resistance, it would likely trigger a wave of buying interest leading to a substantial price rally. Hence, technical analysis Bitcoin forms a crucial framework for investors and traders looking to navigate this evolving and often unpredictable market.
Understanding Bitcoin Consolidation Dynamics
Bitcoin’s current state of consolidation is characterized by tight price ranges, which often precede significant market movements. This period of lateral price action usually signals indecision among traders, creating an environment ripe for a breakout or breakdown. The fact that Bitcoin is hovering close to the critical $88,000 level indicates that participants in the cryptocurrency market remain cautiously optimistic, anticipating a forthcoming surge in volatility. Consolidation phases can serve to build momentum, and as open interest has begun to climb significantly, the stage is set for a major price decision.
During this consolidation, it’s important to monitor the accumulation of traders taking long positions, especially as the market sentiment appears bullish. A breakout from this consolidation could spark a spike in price, extending gains and potentially reaching levels around $92,000 or even beyond. On the contrary, a failure to maintain support above the $80,000 region could lead to a significant correction, emphasizing the delicate balance BTC is currently navigating. These dynamics showcase the complexity of Bitcoin’s price movements and the necessity for continual technical analysis and market observation.
The Role of Sentiment Analysis in Bitcoin Trading
Sentiment analysis plays an essential role in shaping price movements in the cryptocurrency market, and Bitcoin is no exception. As BTC hovers around the $85,000 mark, the increasing open interest—now approximately $28 billion—reflects heightened speculative activity in the derivatives market. This sentiment can act as both a warning and an opportunity for traders. Historically, surges in open interest during stabilizing or slightly increasing price movements precede significant breakouts or plunges, validating the importance of sentiment as a driving force in Bitcoin price action.
If the current trend persists, traders should prepare for a substantial market reaction—whether upward or downward. A confident move to breach the $88,000 resistance could unleash a torrent of buying, prompting a powerful rally towards the higher price targets. Conversely, a rejection at this level could precipitate panic selling, resulting in a liquidation cascade of long positions. Understanding this complex interplay of sentiment and price action is vital for traders aiming to capitalize on Bitcoin’s unpredictable nature, underscoring the need for comprehensive analysis in their trading strategies.
Identifying Key Resistance Levels in Bitcoin’s Journey
In trading Bitcoin, recognizing key resistance levels is fundamental for developing a successful strategy. Currently, the $88,000 mark stands as a significant barrier for BTC, creating an atmosphere of anticipation for both traders and investors. If Bitcoin can achieve a clean break above this level, it would not only validate bullish sentiment but also set the stage for a potential ascent towards $92,000 and beyond. Therefore, traders must closely watch this zone for signs of strength or weakness, as it will provide essential clues to potential future price movements.
Furthermore, it is crucial to regard the surrounding support levels, particularly the $80,000 mark. A retraction in price toward this area could suggest a bearish trend, compelling traders to reassess their positions and strategies accordingly. Recognizing how Bitcoin interacts with these resistance and support levels reinforces the importance of integrating technical analysis into trading decisions. This strategic understanding can help traders mitigate risks and enhance their probability of success in navigating Bitcoin’s volatile price landscape.
Market Structure: Analyzing Bitcoin’s Patterns
Analyzing the market structure of Bitcoin provides valuable insights into the prevailing trends and patterns that can inform trading strategies. As BTC continues to exhibit an upward trajectory from the March sell-off, short-term structures displaying higher highs and lower lows become pivotal for identifying bullish momentum. This pattern not only indicates a bullish stance but also raises fundamental questions regarding the sustainability of this momentum in light of the impending resistance at $88,000.
Traders should therefore emphasize a comprehensive examination of market structures, particularly in conjunction with sentiment analysis, to ascertain the strength of Bitcoin’s current bullish sentiment. Understanding how Bitcoin’s price has reacted to similar patterns in the past can provide a framework for anticipating future behavior. With the dynamics of the cryptocurrency market being ever-evolving, maintaining an agile approach will be key to capitalizing on Bitcoin’s intricate price action.
Upcoming Bitcoin Breakout Scenarios
As Bitcoin indexes its recent performance, the next breakout scenario becomes a focal point for investors looking to capitalize on rising BTC prices. If technical analysts are correct in their assessments, a decisive break above the $88,000 resistance could trigger a significant rally, sending Bitcoin towards desired price levels like $92,000 and $100,000. Observing trading volume and market sentiment at this crucial point will be vital, as a surge beyond this boundary may signify enduring bullish sentiment within the cryptocurrency market.
Conversely, if Bitcoin fails to breach this resistance, it may face a rejection that leads it back to test the $80,000 support zone. Such developments could provoke a wave of liquidations in long positions, intensifying market volatility. Being aware of these possible breakout scenarios will empower traders to make informed decisions in response to Bitcoin’s rapidly changing landscape. Thus, preparation for both bullish and bearish outcomes is essential for successful trading, ensuring that investors can navigate the high-stakes world of Bitcoin effectively.
Strategic Trading Tips for Bitcoin Investors
In light of recent market fluctuations, developing strategic trading tips for Bitcoin investors becomes paramount. A sound strategy may include setting clear price alerts around critical levels such as $88,000 and $80,000; this allows traders to stay informed and responsive to sudden market movements. Staying attentive to market sentiment, particularly surrounding open interest and trading volume, can also enhance decision-making processes—empowering investors to act swiftly during bullish or bearish conditions.
Moreover, employing a combination of technical indicators, such as RSI and moving averages, could provide additional validation for entries and exits. For traders navigating through consolidation periods, a focus on breakout confirmation can significantly improve the likelihood of capitalizing on upward moves. By adhering to disciplined trading practices and utilizing well-informed strategies, Bitcoin investors can navigate the volatile waters of this cryptocurrency market with greater confidence.
Frequently Asked Questions
What factors influence Bitcoin price analysis and how can they predict BTC price movements?
Bitcoin price analysis is influenced by various factors including market sentiment, technical indicators, and historical price patterns. Key elements such as the 200-day moving average serve as critical resistance levels, while the price structure (higher highs and lower lows) can indicate potential bullish momentum. By analyzing these factors, traders can make informed BTC price predictions, especially during consolidation phases.
How does Bitcoin consolidation affect future BTC price predictions?
Bitcoin consolidation periods typically indicate a pause in significant price movements, allowing traders to analyze existing market conditions. During consolidation, BTC price predictions become more focused on breakout levels, usually identified around key resistance points like the $88,000 mark. Understanding Bitcoin consolidation can help traders prepare for potential shifts in the cryptocurrency market.
What role does technical analysis play in Bitcoin’s price prediction?
Technical analysis plays a vital role in Bitcoin price predictions by examining price charts, indicators, and patterns that can signal future price movements. Utilizing tools such as moving averages, the RSI, and trendlines, traders can identify bullish or bearish trends in Bitcoin prices, aiding their decision-making during periods of volatility.
What are the signs of a Bitcoin breakout in the current BTC price analysis?
In the current Bitcoin price analysis, signs of a potential breakout include a sustained move beyond the $88,000 resistance level and the confirmation of higher highs on shorter timeframes like the 4-hour chart. If Bitcoin’s price successfully surpasses this level, it could trigger a rapid rally towards $92,000 and possibly $100,000, indicating bullish market sentiment.
How does open interest correlate with Bitcoin price analysis and market volatility?
Open interest is a key indicator in Bitcoin price analysis, representing the total number of outstanding derivative contracts. An increase in open interest, particularly during sideways or bullish price action, often precedes significant market volatility. If Bitcoin’s price continues to rise, the buildup of long positions could result in a bullish squeeze, while resistance could lead to a liquidation cascade, amplifying the volatility.
What are the implications of Bitcoin’s current price positioning for future BTC price analysis?
The current price positioning of Bitcoin just below the 200-day moving average suggests a critical juncture for future price movements. If BTC can achieve a daily close above this technical barrier, it may attract bullish momentum and pave the way for upward price predictions. Conversely, repeated rejections at this level highlight potential risks in the cryptocurrency market that traders should monitor closely.
How does the sentiment in the cryptocurrency market impact Bitcoin price analysis?
Market sentiment plays a crucial role in Bitcoin price analysis as it reflects traders’ collective mood regarding future price movements. High bullish sentiment can lead to increased buying pressure, while bearish sentiment often corresponds to selling trends. Thus, understanding sentiment alongside technical analysis helps traders make more accurate BTC price predictions and navigate potential market shifts.
| Aspect | Key Points |
|---|---|
| Current Price Scenario | Bitcoin is currently trading below the 200-day moving average, around $88,000, which acts as a significant resistance level. |
| Technical Analysis (Daily Chart) | Prices show a potential bullish trend but need to close above $88,000 to reach $92,000 and $100,000. The $80,000 level is critical to maintain a recovery structure. |
| Technical Analysis (4-Hour Chart) | BTC has broken above a descending trendline and is consolidating below the $86,000–$88,000 supply zone. A breakout above $88,000 could lead to a rapid price rally. |
| Futures Market Sentiment | Open interest in the futures market is rising, indicating increased speculative trading activity. A price breakout could trigger a squeeze in long positions. |
| Conclusion | Overall, the Bitcoin price analysis suggests that BTC is at a pivotal moment where a breakout above resistance levels is crucial for its upward trajectory. |
Summary
Bitcoin price analysis shows that the cryptocurrency is currently navigating a crucial phase as it attempts to escape the consolidation range. As it hovers just below the 200-day moving average at $88,000, the market sentiment is ramping up, suggesting that a breakout might be imminent. The daily chart indicates recovery potential, but price action remains volatile, necessitating a sustained close above key levels for future gains. Investors should remain vigilant as any significant movements could lead to substantial price volatility.
Bitcoin price analysis is crucial for understanding the current dynamics of the cryptocurrency market. As Bitcoin continuously battles to break free from its consolidation range, many investors are eager to uncover the factors influencing BTC price prediction and potential upward movements. Recent trends show a significant push towards reclaiming the 200-day moving average, yet the price struggles to pierce through the resistance level of $88,000. This tight trading zone has led to widespread speculation about potential Bitcoin breakout scenarios, with many analysts employing technical analysis Bitcoin techniques to gauge future price trajectories. With the market sentiment leaning towards volatility, knowledgeable traders must stay alert to capitalize on both upward and downward price movements in the coming weeks.
When examining Bitcoin’s market performance, a thorough understanding of its price dynamics and trends becomes essential. The analysis of BTC, often referred to as the leading digital currency, plays a pivotal role not just for traders but for anyone interested in the crypto landscape. Insights into its current consolidation patterns and breakout potential offer a glimpse into how external factors might influence its future performances. Investors rely on various predictive models and technical indicators to develop informed strategies, especially during pivotal moments marked by high trading volume in the cryptocurrency sector. Evaluating these perspectives provides a comprehensive view of Bitcoin’s positioning within the broader financial ecosystem.