In the ever-evolving landscape of cryptocurrency, Dogecoin price analysis reveals intriguing patterns that capture the attention of investors and traders alike. With an impressive rally exceeding 78% in just 38 days, this digital asset has shown resilience, according to analysts on platforms like X. Their investigations into DOGE’s performance unearth a series of classical continuation patterns, particularly the noteworthy inverse head-and-shoulders formation that suggests a sustained upward trajectory for Dogecoin. As market participants evaluate the potential DOGE price target, the prevailing trend indicates a possible bullish convergence around the mid-$0.30 range. This cryptocurrency analysis highlights not just the momentum behind the Dogecoin rally but also the underlying strength projected in recent trading behaviors.
Examining the recent surge of Dogecoin provides insight into market dynamics beyond simple price movements. The phenomenal increase of Dogecoin can be attributed to favorable technical patterns, specifically an inverse head-and-shoulders setup that underscores its bullish potential. As traders seek to capitalize on this momentum, attention shifts towards strategic price objectives, with forecasts hinting at target zones reaching into the mid-$0.30 territory. Understanding Dogecoin trends is crucial for investors looking to navigate these volatile waters effectively. This multidimensional look at DOGE’s trajectory not only enriches the ongoing cryptocurrency discourse but also emphasizes the importance of well-informed analysis.
Understanding Dogecoin’s Price Rally
Dogecoin has experienced a remarkable rally of over 78% within a mere 38 days, drawing attention from both cryptocurrency enthusiasts and analysts alike. This surge is not seen as a fleeting moment but rather a significant progression in Dogecoin’s price dynamics. Analysts such as Bluntz and TSG have conducted substantial studies reinforcing their predictions that this surge is backed by robust market movements rather than mere speculation. With the price peaking at around $0.2597, their observations are crucial for understanding the current trends in the Dogecoin market.
The implications of this rally extend beyond immediate price gains. Both analysts identify classical price patterns, particularly an inverse head-and-shoulders formation, which has historical significance in forecasting potential upward movements. Such technical analysis suggests that the next price target for Dogecoin might be within the mid-$0.30 range, thus consolidating an optimistic outlook in a market often characterized by volatility. As profit-taking begins, maintaining awareness of these trends and price targets is essential for investors.
Technical Patterns in Dogecoin Trading
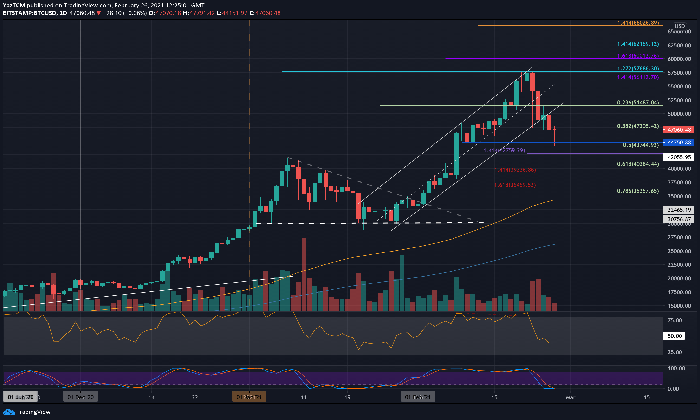
A significant pattern identified in Dogecoin’s recent price action is the inverse head-and-shoulders formation highlighted by Bluntz. This pattern crucially indicates a potential reversal in the prevailing price trend, offering insights into future movements. The left shoulder formed around $0.142, with the head at approximately $0.129, and the right shoulder completing at about $0.164. Such patterns are instrumental in technical analysis, providing traders with visual cues for potential buy and sell signals.
Turning to the volume analysis, Bluntz notes an unprecedented surge in trading volume, marking one of the heaviest clusters since February. This volume accompanying the breakout from the $0.20 resistance is a critical indicator of sustainable bullish momentum. As this pattern has been validated by actual market engagement rather than speculative buy orders, it reinforces trader confidence in aiming for higher price targets in the near term.
Future Price Projections for DOGE
Analysts have laid out ambitious projections for Dogecoin’s price trajectory after this recent rally. With the breakout from the $0.20 neckline, movements towards targets in the region of $0.26 to $0.28 are backed by measured-move analysis of the inverse head-and-shoulders. The technical foundation for these targets suggests a calculated approach to projecting price movements, as the market appears to have reset from overbought conditions. Staying above the crucial $0.20 level is essential for maintaining bullish sentiment in the short term.
Moreover, combining insights from TSG’s analysis, there’s a calculated anticipation of a further spike towards approximately $0.32928 if key resistance is broken. This forecast aligns with the observed market behaviors within parallel channels, establishing an optimistic long-term forecast for DOGE. Investors should watch these levels closely, as a fall below $0.20 would necessitate reevaluating bullish strategies.
Momentum Indicators in Dogecoin Analysis
In the context of cryptocurrency analysis, momentum indicators play a crucial role in determining the strength of a price movement. For Dogecoin, the Relative Strength Index (RSI) is currently in the low-60s, suggesting that while the recent rally saw an oversold condition, the current momentum remains intact. A healthy RSI implies that while the market is consolidating after a surge, it hasn’t lost the bullish structure—paving the way for potential upward movements.
As traders observe these momentum indicators, it becomes increasingly vital to maintain vigilance regarding overbought signals. With the RSI indicating that conditions are stabilizing, the possibility of another price surge can be anticipated if Dogecoin can consolidate its gains effectively. Therefore, for those invested or looking to enter, understanding these momentum shifts will significantly influence trading decisions.
The Role of Traders in Dogecoin’s Price Dynamics
The engagement of traders significantly influences the price dynamics of Dogecoin, particularly during substantial rallies. Analysts agree that the underlying market behavior during the recent surge has been shaped by genuine trader participation rather than speculative frenzy. This level of genuine engagement is crucial for sustaining upward trends as it indicates confidence in Dogecoin’s price prospects.
As Dogecoin continues to attract attention, traders must be acutely aware of market sentiment and historical price patterns. By leveraging charts and technical indicators, traders can enhance their strategy to capitalize on potential bullish movements. The market trends from the past weeks underscore the importance of this community-driven enthusiasm that drives price actions in the crypto space.
Influence of External Factors on Dogecoin
External factors, including media coverage and market sentiment, play a pivotal role in shaping Dogecoin’s price, particularly during rally phases. The influence of prominent influencers and social media has elevated Dogecoin to immense popularity, which subsequently affects trading volume and overall liquidity. Observing these external factors is essential for a thorough understanding of future price fluctuations.
Additionally, macroeconomic conditions and changes in cryptocurrency regulations can dramatically impact Dogecoin’s price trajectory. As regulatory conversations evolve, they can contribute to market sentiment, either bolstering confidence or inducing panic among traders. Recognizing these factors enables better forecasting and strategic planning for investors navigating the ever-changing landscape of cryptocurrency.
The Importance of Proper Risk Management
In the volatile landscape of cryptocurrency trading, proper risk management is paramount, especially for assets like Dogecoin that have seen significant price fluctuations. Investors should ensure they are not overly exposed to potential losses by employing strategies that align with their risk tolerance. As Dogecoin targets the mid-$0.30 range, understanding how to manage these risks effectively will enhance the potential for profitable trading.
Additionally, incorporating a systematic approach to risk management involves setting stop-loss orders and monitoring market conditions closely. Given the dynamic nature of cryptocurrency, adhering to a well-defined risk management strategy allows traders to respond appropriately to market changes, ultimately safeguarding their investments while seeking opportunities in this bullish environment.
Monitoring Market Sentiment Towards Dogecoin
Market sentiment can significantly influence Dogecoin’s price movements and is a vital aspect of technical analysis. The recent bullish rally of Dogecoin indicates a positive shift in sentiment among traders and investors, which can lead to further price increases if sustained. Analysts observe that understanding market sentiment provides a clear indication of whether the bullish trend can continue beyond the immediate targets set by technical patterns.
Moreover, tools such as sentiment analysis can help to gauge public perception and predict potential price changes. By applying these insights, traders can position themselves advantageously in the market, highlighting the importance of staying attuned to prevailing sentiment shifts as they plan their trading strategies.
Utilizing Chart Patterns for Dogecoin Decisions
Chart patterns are vital for making informed trading decisions in the cryptocurrency space. In Dogecoin’s case, the formations identified by analysts, particularly the inverse head-and-shoulders, serve as valuable indicators for future price movements. By studying these patterns, traders can better grasp entry and exit points, enhancing their potential for successful trades.
Furthermore, understanding how to interpret these chart patterns in conjunction with volume and momentum indicators equips traders to make well-rounded decisions in trading Dogecoin. As prices fluctuate and patterns develop, leveraging this technical analysis approach can be instrumental in navigating an otherwise volatile market.
Frequently Asked Questions
What does Dogecoin price analysis reveal about the recent Dogecoin rally?
Dogecoin price analysis indicates that the recent rally of over 78% within 38 days is significant and likely not a fleeting surge. Analysts have identified classical continuation patterns that suggest potential further growth, particularly with targets in the mid-$0.30 range.
How does the inverse head-and-shoulders pattern affect Dogecoin price targets?
The inverse head-and-shoulders pattern identified in Dogecoin price analysis provides a bullish outlook. This pattern suggests an initial price target of $0.26-$0.28, reinforcing the possibility of reaching the $0.30 mark if bullish momentum continues.
What are the potential Dogecoin price targets following the recent trends in DOGE?
Current Dogecoin price analysis suggests targets range between $0.26-$0.28 based on the inverse head-and-shoulders pattern, with a longer-term target near $0.32 depending on sustained bullish momentum following the recent uptrend.
What role does the RSI play in Dogecoin price analysis after the recent rally?
In Dogecoin price analysis, the RSI (Relative Strength Index) has recently cooled to the low-60s after briefly entering overbought territory. This indicates that although there was a strong rally, the market has now reset without losing the bullish structure, suggesting continued positive momentum.
How significant is the $0.20 level in Dogecoin price analysis?
The $0.20 level is critical in Dogecoin price analysis as it serves as a major support barrier. A four-hour close below this level could invalidate bullish momentum. Maintaining above it is crucial for the potential to target mid-$0.30 prices.
What is the bull flag identified in Dogecoin price trends, and what target does it suggest?
The bull flag identified in Dogecoin price trends indicates a consolidation within a descending parallel channel between $0.22 and $0.26. A breakout from this formation suggests a target of approximately $0.32928 as per recent Dogecoin price analysis.
Are there risks identified in the Dogecoin price analysis regarding potential pullbacks?
Yes, Dogecoin price analysis indicates risks of pullbacks, especially if it closes below $0.20. Analysts note that if the flag fails, the price could retreat to a support zone between $0.16 and $0.21, providing a critical area for re-entry.
What do analysts say about Dogecoin price trends and future moves?
Analysts emphasize that the current Dogecoin price trends are bullish, with expectations of upward movement. If Dogecoin remains above $0.20, further price escalations into the $0.30s are anticipated, based on current momentum and patterns observed.
| Key Point | Details |
|---|---|
| Recent Rally | Dogecoin has rallied over 78% in the past 38 days. |
| Peak Price | The price reached a peak of $0.2597. |
| Continuation Patterns | Both analysts noted classical continuation patterns confirmed by price movements. |
| Bullish Targets | Next price targets are projected in the mid-$0.30 range. |
| Technical Analysis | Bluntz highlighted an inverse head-and-shoulders pattern; TSG observed a bull flag in a descending channel. |
| RSI Status | The RSI remains positive, indicating potential for continued bullish momentum. |
| Support Levels | Key support level at $0.20; if breached, further support exists between $0.16 and $0.21. |
Summary
Dogecoin price analysis indicates a strong bullish trend, backed by recent technical patterns and supportive studies from market analysts. As Dogecoin continues to trade above critical levels, especially above $0.20, the outlook remains positive, with expectations of reaching targets in the mid-$0.30 range. Analysts’ insights suggest that the momentum is firmly in favor of the bulls, hinting at a potential journey towards higher price points if key levels are maintained.
In this Dogecoin price analysis, we delve into the remarkable rally that has seen DOGE climb over 78% in just 38 days, capturing the attention of investors and market analysts alike. Two respected chartists, Bluntz and TSG, have conducted independent studies revealing potential continuation patterns that suggest this surge is far from fleeting. Having reached a peak of $0.2597, the prevailing sentiment indicates that the next significant DOGE price target could lie within the mid-$0.30 range if bullish trends continue. Notably, Bluntz has identified an ideal inverse head-and-shoulders formation which provides a robust technical foundation for this prediction. As we explore these developments, we will also consider the broader implications of recent Dogecoin trends in the context of cryptocurrency analysis.
Analyzing Dogecoin’s recent performance unveils an impressive ascent that suggests a sustained market interest. With a substantial increase over a short period, DOGE’s upward trajectory is characterized by key technical patterns that many analysts consider will influence its future valuation. Specifically, terminology around cryptocurrency dynamics, such as price targets and bullish trends, plays a crucial role in understanding where Dogecoin is headed next. Furthermore, concepts like the inverse head-and-shoulders pattern can help investors gauge potential breakout points and price consolidation levels. As more traders integrate these analytical frameworks into their strategies, they become adept at navigating the evolving landscape of digital currencies.